
This is the final post in our smart-money series, and it's the one that ties the rest of the toolkit together.
Across the past twelve weeks we've covered execution tools: Order Blocks for institutional zones, Breaker Blocks for failed positioning, CISD for delivery shifts, Silver Bullet for timing windows, SFP and Liquidity Sweeps for stop hunts, Buyside & Sellside for the liquidity map. Each of those posts said the same thing in different words: the indicator surfaces the local pattern; you need a directional bias from somewhere else to filter it.
This post is "somewhere else." ICT Bias is the higher-timeframe directional engine that every other tool in the toolkit ultimately defers to. It's not a pattern detector and it's not an entry trigger. It's the upstream input that decides which patterns to trade and which to skip.
What the bias actually does
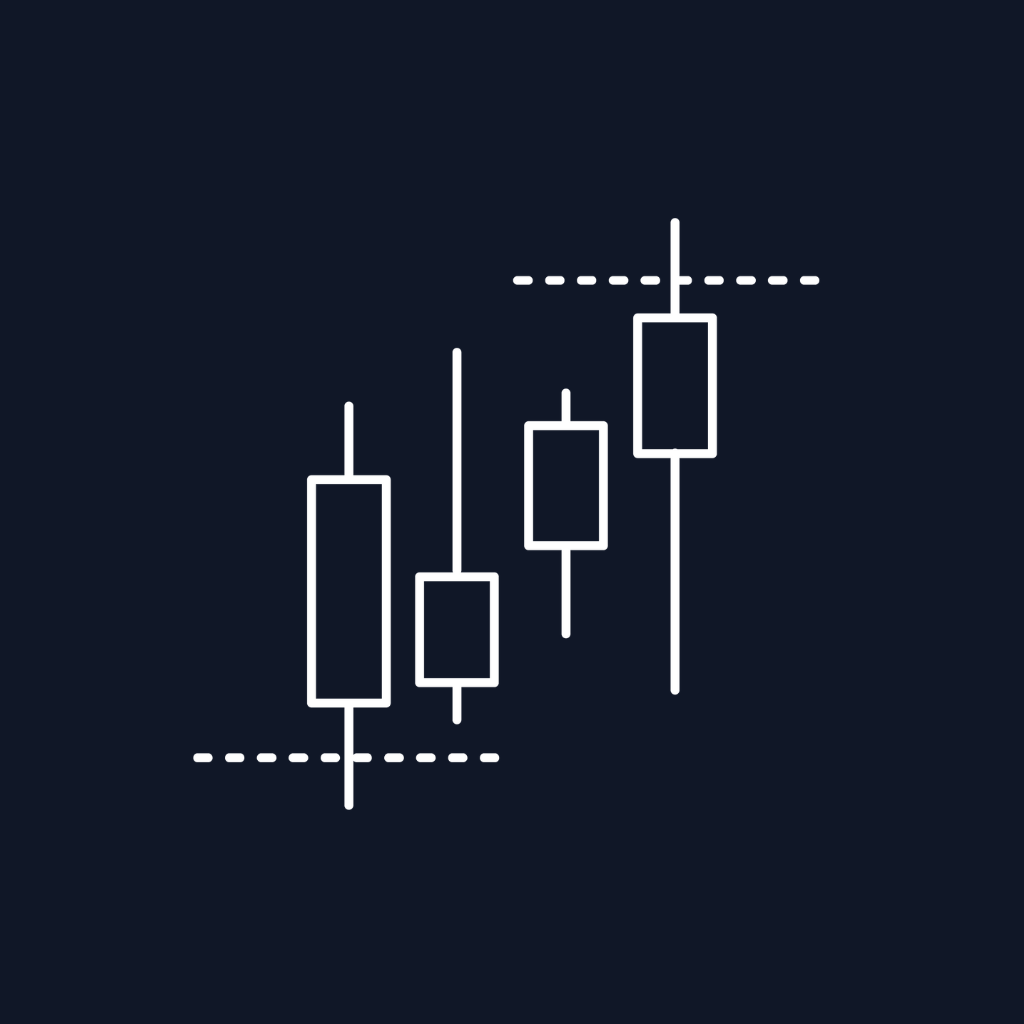
The ICT Bias indicator takes the previous period's high and low — by default the previous day high (PDH) and previous day low (PDL), or the previous week high (PWH) and previous week low (PWL) — and translates how the current bar's close interacted with those levels into one of three states: bullish bias targeting the previous period high, bearish bias targeting the previous period low, or no bias.
The core idea: how price closed relative to yesterday's extremes tells you what today's draw on liquidity probably is. If price closed strongly above PDH, the daily delivery is moving up and the next obvious target is the next high. If price failed to close above PDH despite trading through it, the rejection is meaningful and the draw flips to the opposite side. The indicator codifies all six possible interactions and assigns each one a bias automatically.
The six bias conditions, exactly
Pulled directly from the indicator's logic — these are the six conditions that get evaluated at the close of every period (every new day for daily bias, every new week for weekly bias):
1. Close Above PDH → Bias PDH
If price closes above the previous period high, the following period's bias targets that previous high. The label "Close Above PDH" prints; the bias is bullish; the directional draw is upward. This is the textbook breakout-and-confirm condition.
2. Close Below PDL → Bias PDL
If price closes below the previous period low, the bias targets the previous period low. Bearish; downward draw. The mirror image of condition 1.
3. Failed to Close Above PDH → Bias PDL
This is the one that catches most discretionary traders. Price traded above PDH during the period but failed to close above it. The wick-out without follow-through is a rejection at the highs, which flips the bias to the downside — the next draw is the previous period low. Bullish-looking price action, bearish bias.
4. Failed to Close Below PDL → Bias PDH
Mirror of 3. Price wicked below PDL but closed back inside the range. The failed break flips the bias upward.
5. Close Inside the Range → Bias depends on the previous candle's color
The inside-bar condition. Price stayed entirely within PDH and PDL — neither extreme was touched. The bias resolves to the side that the previous period closed toward: if the previous period closed green (above its open), the bias is bullish targeting PDH; if the previous period closed red, bearish targeting PDL. The logic: continuation from the last clear directional read.
6. Outside Bar that Closed Inside → No Bias
The unique no-bias condition. Price took out both PDH and PDL but closed back inside the range. Both extremes were swept; the close settled in the middle. Neither side has a clean read, so the indicator assigns no bias and recommends standing aside for the next period.
That last condition matters more than it sounds. Most bias indicators force a directional read on every period. ICT Bias explicitly recognizes that some periods don't print a clean signal, and the discipline of standing aside on those periods is built into the rules.
Level 1 and Level 2: stacking the bias
The indicator runs two independent bias calculations simultaneously. Level 1 defaults to the daily timeframe; Level 2 defaults to the weekly. Both calculations apply the same six conditions to their respective higher-timeframe data, and both publish their bias signal independently.
The intended use is alignment-based:
- Both levels bullish: highest-conviction long bias. Weekly delivery is up; daily delivery is up. Trade longs from your execution tools with full size.
- Both levels bearish: highest-conviction short bias. Same alignment in reverse.
- Levels disagree: reduced conviction. The weekly bias is the larger frame; the daily is a counter-trend pullback within the weekly delivery. Either trade smaller or wait for re-alignment.
- Either level shows no bias: reduced conviction or stand aside entirely depending on the conflict.
You can change the timeframe for either level. The available options are 15 minutes, 30 minutes, 1 hour, 4 hours, daily, and weekly. For intraday traders, a common configuration is Level 1 on the 1-hour and Level 2 on the daily — hourly bias for short-term execution context, daily bias as the broader filter. For swing traders, daily on Level 1 and weekly on Level 2 is the textbook setup.
The statistics table: bias by the numbers
The indicator tracks two statistics for every bias type, separated by direction and by level. For each of "Previous D High," "Previous D Low," "Previous W High," and "Previous W Low," the table records:
- Success Rate: how often, when a given bias was assigned, price actually reached the targeted level during the subsequent period.
- Close Through Rate: of the times price reached the target, how often it closed through that level rather than rejecting at it.
- Sample Size: the total number of times this bias has been assigned across the loaded chart history.
This is the part most users underweight. The statistics table tells you, on the specific instrument and timeframe you're trading, how reliable each bias has been historically. A PDH bias with a 73% success rate and 200 samples is doing different work than a PWL bias with a 50% success rate and 12 samples. Same indicator; very different signal quality. The statistics make the difference visible and quantifiable.
For automation work, these numbers also let you weight your strategy. A signal that fires when the active bias is in a 70%+ historical bucket is meaningfully different from one that fires when the bias is in a 50% bucket. The hidden plots expose both the bias direction and the underlying reason code, so a strategy can ingest both.
How to actually use bias in execution
The bias is upstream. Every execution decision flows from it. Three concrete patterns:
1. Use bias to filter every execution-tool signal
The most common application. Whatever execution tool you're running — Order Blocks, Breaker Blocks, CISD, Silver Bullet, SFP, Liquidity Sweeps — only take signals that align with the bias. Bearish daily bias means you skip every long Order Block and only take short Order Blocks. Bullish weekly bias means you skip every short Breaker Block setup.
This is the rule that fixes the most P&L damage in retail trading: taking high-quality patterns in the wrong direction. The pattern itself is real; the entry is fine; the problem is that the higher timeframe was pulling the other way the whole time. Bias as a filter removes that error category entirely.
2. Use bias targets as profit targets
The bias names the draw — PDH or PDL for Level 1, PWH or PWL for Level 2 — and the indicator draws those levels on the chart as horizontal lines. Once price reaches the targeted level, the line color flips from the standard color to the "hit" color, signaling that the draw has been delivered.
For traders working off the execution tools, this gives you a structural profit target tied directly to the bias logic. A long Order Block entry with bullish daily bias targets PDH as the first take-profit; a short Liquidity Sweep with bearish weekly bias targets PWL. The bias names the destination; the execution tool times the entry.
3. Use bias misalignment as a warning signal
When Level 1 and Level 2 disagree — daily bullish but weekly bearish, for example — the conflict is information in itself. The daily delivery is fighting the weekly delivery, which typically resolves into either a sharp reversal or a slow grind. Neither is a clean trading environment. Reducing size or sitting out during misaligned periods is usually the right call, and the statistics table on your instrument will confirm whether your specific market rewards or punishes counter-bias trades.
Common mistakes
Forcing a trade against the bias because the pattern looks perfect. The most expensive habit in retail trading. A great Order Block in the wrong direction is still in the wrong direction. The execution tool surfaces the pattern; the bias decides whether the pattern is worth trading. The pattern looking good is not an argument against the bias.
Ignoring the "No Bias" condition. When the previous period was an outside bar that closed inside the range, the indicator assigns no bias for a reason: there isn't one. Treating those periods as regular trading days and forcing setups through anyway is one of the cleanest losing patterns in the data.
Running bias on too low a timeframe. 15-minute and 30-minute bias is available, but for most discretionary traders the daily and weekly biases do the real filtering. Lower-timeframe bias produces too many flips to function as a stable directional filter — by the time you've adjusted your stance, the bias has moved again.
Trusting the bias without checking the statistics. The bias logic is the same on every instrument, but the historical reliability isn't. Some instruments produce 75% success rates on certain bias conditions; others produce 50%. Check the statistics table for your specific market before weighting the bias heavily.
Trading the bias directly instead of as a filter. The bias tells you the directional draw; it doesn't tell you the entry. Buying at any price because the bias is bullish exposes you to drawdown on every pullback. The bias filters which patterns to take from your execution tools; the execution tools provide the entry timing.
The capstone
Across the past twelve weeks the same pattern has come up over and over: every execution indicator we've covered is a precision tool that needs directional context to function well. Order Blocks at random are zones in space; Order Blocks with bias become entries. CISD without bias is a reversal candle; CISD with bias is a reversal candle in the direction the higher timeframe wants. Liquidity sweeps without bias are pattern detections; liquidity sweeps with bias are aligned entries with structural targets.
The ICT Bias indicator is what supplies that context. Six logic conditions, two independent timeframe layers, tracked historical statistics, and hidden plots for automation — all of it adding up to a single upstream filter that turns every other tool in the stack from a signal generator into a directional trading system.
If you've been working through this series and adding pieces to your toolkit, this is the piece that ties the rest of it together. The execution tools tell you what's happening locally. ICT Bias tells you which way the larger machine is turning, so the local signals align with the broader move instead of fighting it.
The full smart-money stack
One last look at how all thirteen weeks fit together:
- Bias engine: ICT Bias — daily and weekly directional context (this post)
- Liquidity map: Buyside & Sellside Liquidity — where stops sit (post)
- Event detection: Liquidity Sweeps (post) and SFP (post) — when the stops actually get hit
- Zone tools: Order Blocks with Market Structure (post) and Breaker Blocks (post) — institutional positioning zones
- Reversal timing: CISD (post) — the precise delivery shift candle
- Execution windows: ICT Silver Bullet (post) — the one-hour windows that outperform
Thanks for following the series. Every indicator above stands on its own; together they form a coherent read on smart-money behavior from the directional context all the way down to the execution candle.
Disclaimer: Trading futures and other leveraged instruments involves substantial risk of loss and is not suitable for all investors. Past performance and indicator signals are not indicative of future results.