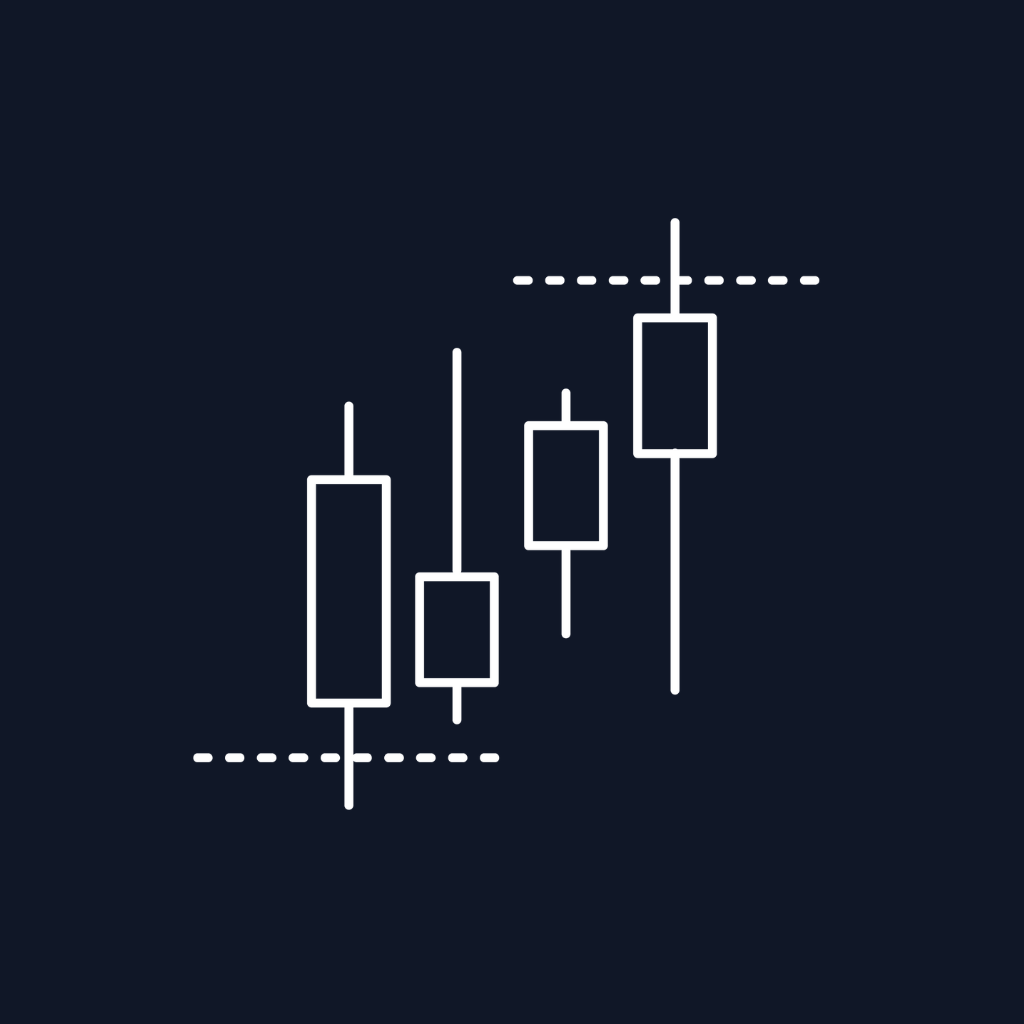

Markets don't move toward random prices. They move toward liquidity — specifically, toward the resting stop orders clustered above recent swing highs and below recent swing lows. That liquidity is the fuel institutional algorithms need to fill large orders, and the levels where it sits act as price magnets in a way that pure technical analysis can't explain.
Understanding where those liquidity pools live is what separates traders who get stopped out of obvious trades from traders who anticipate the sweep and trade with it. The Buyside & Sellside Liquidity Indicator maps those pools mechanically: every cluster of stops above swing highs (buyside), every cluster below swing lows (sellside), every breach, and every liquidity void left behind by rapid displacement.
Where SFP catches the precise bar of an individual sweep and Silver Bullet times the windows where sweeps tend to occur, this indicator answers the prior question: where are the liquidity pools in the first place?
What "buyside" and "sellside" liquidity actually mean
The naming is counter-intuitive at first, so it's worth being explicit:
- Buyside liquidity sits above swing highs. It's called buyside because the stop orders parked there are buy stops — they belong to short sellers protecting their positions, and to breakout buyers waiting to enter long on a break of the swing. When price sweeps a buyside pool, those buy stops trigger, generating the buying pressure institutions need to fill large sell orders.
- Sellside liquidity sits below swing lows. The stop orders parked there are sell stops — protecting long positions and waiting to enter short on a breakdown. When price sweeps a sellside pool, those sell stops trigger, generating the selling pressure institutions need to fill large buy orders.
The key insight: liquidity is named after the order type resting there, not the direction institutions are trading. Institutions sweep buyside liquidity to sell at premium prices. They sweep sellside liquidity to buy at discount prices. Once you internalize that inversion, the entire smart-money model snaps into focus.
How the indicator identifies liquidity pools
The Buyside & Sellside Liquidity Indicator doesn't just mark every swing high and low. It looks for clusters — multiple pivot highs or lows that converge within an ATR-based proximity tolerance of each other. A single isolated swing doesn't qualify; three or more swings within close range of one another do.
Mechanically, the indicator runs through five stages:
- Pivot detection. Identifies swing highs and lows using the configurable Detection Length parameter (default 7 bars).
- Cluster analysis. For each new pivot high, scans the history for prior pivots within an ATR-based tolerance (controlled by the Margin parameter, default 6.9). If three or more cluster together, the level qualifies as a liquidity pool.
- Level drawing. Draws a solid line from the earliest pivot in the cluster to the most recent, then extends a dotted forecast line forward. The solid portion is the historical liquidity zone; the dotted portion is the projection.
- Breach detection. When price sweeps the liquidity pool, the indicator records the breach, terminates the dotted line, and renders a colored zone showing where the sweep occurred. The zone marks the reversal or continuation area.
- Zone management. If price returns to test the breached zone, the zone stays active; if price closes through and rejects, the zone deactivates.
This cluster-based approach matters because not every swing high is a meaningful liquidity pool. A swing that occurs in isolation usually doesn't hold enough resting stops to attract institutional interest. A swing that aligns with two or three prior swings at roughly the same price represents accumulated stops from multiple sessions — and that's where the magnetic pull comes from.
Liquidity voids: the third feature most users miss
Beyond the buyside and sellside pools, the indicator also detects liquidity voids — price gaps left behind by rapid displacement candles. The detection rule: a candle whose body distance from the prior candle exceeds the 200-period ATR, creating a clean gap that price hasn't filled.
Liquidity voids matter because they represent unfilled orders. When price moves so quickly that it leaves a gap, there's no resting order flow in that range. Markets have a strong tendency to return and fill those voids, because the unfilled liquidity acts as an attractor in the same way clustered stops do.
The indicator draws bullish voids (gaps left by rapid upside displacement) and bearish voids (gaps left by rapid downside displacement) as colored boxes that persist until price returns to fill them. Combined with the buyside and sellside pools, you get a complete map of where price wants to go: toward the liquidity pools to sweep stops, and back through the voids to fill unfilled orders.
How to actually use this in trading
There are four practical applications:
1. Identify the day's draw on liquidity
Before each session, look at where the nearest buyside and sellside pools sit. The nearest pool to current price is the most likely target. If buyside sits above price and sellside sits below, ask: which side has more accumulated liquidity? Which side has been swept more recently? That's your bias for the day. This is exactly the higher-timeframe context the Silver Bullet indicator deliberately doesn't provide — and which we noted in last week's Silver Bullet post as the missing piece traders need to bring themselves.
2. Prioritize SFPs and CISDs at the right levels
An SFP that sweeps a marked buyside liquidity pool is dramatically higher conviction than an SFP at a random swing high. Same for CISD reversals printing after a labeled liquidity sweep. The indicator marks which swing levels actually matter; the SFP and CISD indicators time the reversal at those levels. Two independent signals reinforcing each other.
3. Trade the post-breach zone reaction
When price sweeps a liquidity pool, the indicator renders a colored zone showing the breach area. Price often returns to retest that zone before continuing. A return to a breached buyside zone after a clean sweep frequently rejects and continues lower; same for sellside in the opposite direction. The breach zone becomes a high-probability re-entry point.
4. Use liquidity voids as targets
If a void sits below current price and the broader bias is bearish, the void acts as a magnet — price is statistically likely to return to fill it. Combine that with a buyside sweep at the top of the move and you have both a setup (the sweep at the buyside pool) and a target (the void below).
Configuration choices that matter
Two settings control the indicator's sensitivity:
Detection Length (default 7): Controls how many bars the indicator looks back to qualify a swing. Lower values produce more pivots and tighter liquidity pools. Higher values produce fewer pivots but stronger ones. On lower timeframes (1–5 min), the default works. On 15-min and higher, consider raising it to 10 or higher.
Margin (default 6.9): Controls how close pivots need to be to count as a cluster. The actual tolerance is ATR ÷ (10 ÷ Margin) — so a higher Margin value means a wider tolerance and more clustering, while a lower value means a tighter tolerance and fewer (but stronger) levels. If you find the indicator drawing too many overlapping levels, lower the Margin to 4 or 5. If you're missing clusters that look obvious by eye, raise it to 8 or 9.
The Run Mode setting also matters: Present mode shows only currently relevant levels and is faster; Historical mode draws every level identified across the chart's history. Use Present for live trading and Historical when back-testing or reviewing past sessions.
Where this fits in the cluster
Worth being explicit about, since each tool in this series plays a distinct role:
- Order Blocks mark zones where institutions positioned. The "where they entered" map.
- Breaker Blocks mark zones where positioning failed and flipped. The "where they got stopped" map.
- CISD marks the precise candle where delivery direction changed across a sequence. Timing tool.
- SFP marks single-bar liquidity grabs. Single-event timing tool.
- Silver Bullet times the windows where institutional repricing happens. Execution framework.
- Buyside & Sellside Liquidity maps the actual liquidity pools that all of the above target. Structural foundation.
This is the "where" tool. Every other tool in the cluster answers questions about timing or pattern. This one answers the prior question: where on the chart does the smart-money game actually get played? Without the answer to that question, you're trading reversals at arbitrary swing levels rather than at the levels that institutions actually care about.
Common mistakes that wreck liquidity trading
Treating every level as equal. Buyside and sellside pools that align with prior session highs/lows, daily highs/lows, or major round numbers carry exponentially more weight than intra-session clusters. The indicator marks both; you need to weight them appropriately.
Trading the pool, not the reaction. The liquidity pool itself isn't an entry. The sweep of the pool followed by a reversal pattern (SFP, CISD, MSS) is the entry. Anticipating the reversal at the pool before it confirms is how traders fade institutional moves and get run over.
Ignoring the breach zone. Once a pool is breached, the indicator paints a zone showing the sweep area. That zone often becomes the highest-conviction retest level for a re-entry. Most users see the breach and move on, missing the second opportunity the indicator provides.
Setting Detection Length too short. A value of 3 or 4 produces noisy clusters that don't reflect real liquidity. Stay at 7 or higher for typical intraday charts.
Trading without a directional bias. Liquidity pools work both ways — buyside above, sellside below. If you don't have a higher-timeframe bias telling you which pool is more likely to be the day's draw, you're guessing. Combine with ICT Bias or Daily Range Zones for that directional context.
The bigger picture
Buyside and sellside liquidity isn't a signal indicator — it's a map. It doesn't tell you when to enter or exit. It tells you where the institutional game is being played, which is the prior question every other indicator in your stack should be answering against.
The Buyside & Sellside Liquidity Indicator handles the mechanical work: tracking every pivot, identifying clusters, drawing the levels, detecting breaches, marking the post-breach zones, and identifying liquidity voids left behind by displacement. Used as the structural foundation for the reversal and execution tools covered earlier in this series, it transforms scattered swing-level trading into a coherent map of where price actually wants to go.
Related Indicators
Buyside & Sellside Liquidity pairs with the rest of the smart-money toolkit:
- Swing Failure Pattern — times the precise bar of the sweep at each liquidity pool (covered in last week's SFP post)
- CISD — catches the delivery shift after a liquidity sweep at a marked pool (covered in our CISD post)
- ICT Silver Bullet — executes the sweep sequence inside the high-probability windows (covered in our Silver Bullet post)
- ICT Bias — provides the higher-timeframe directional context for which pool is the day's likely draw
Disclaimer: Trading futures and other leveraged instruments involves substantial risk of loss and is not suitable for all investors. Past performance and indicator signals are not indicative of future results.