
Last week we mapped the territory. The Buyside & Sellside Liquidity post covered where the liquidity pools sit — clusters of stops above swing highs and below swing lows that institutions can see and target. This week we cover what happens when those pools actually get hit. Not the static map. The moment of the grab.
The Liquidity Sweeps Indicator detects two distinct stop-hunt signatures as they occur in real time. Where SFP catches a single-bar wick-sweep-and-rejection at a swing level, Liquidity Sweeps captures both the SFP-style pattern and a second, more aggressive sweep signature — the break-and-retest sweep — where institutions trade through the level, retest from the other side, and then continue. Two patterns, same underlying mechanic, very different chart signatures.
The two sweep signatures
Both patterns require the same starting point: a recently formed pivot high or low that represents resting liquidity. Both result in the same institutional outcome: stops get triggered and the position gets filled. But the price action that produces them is visibly different, and the indicator handles both:
Wick Sweep
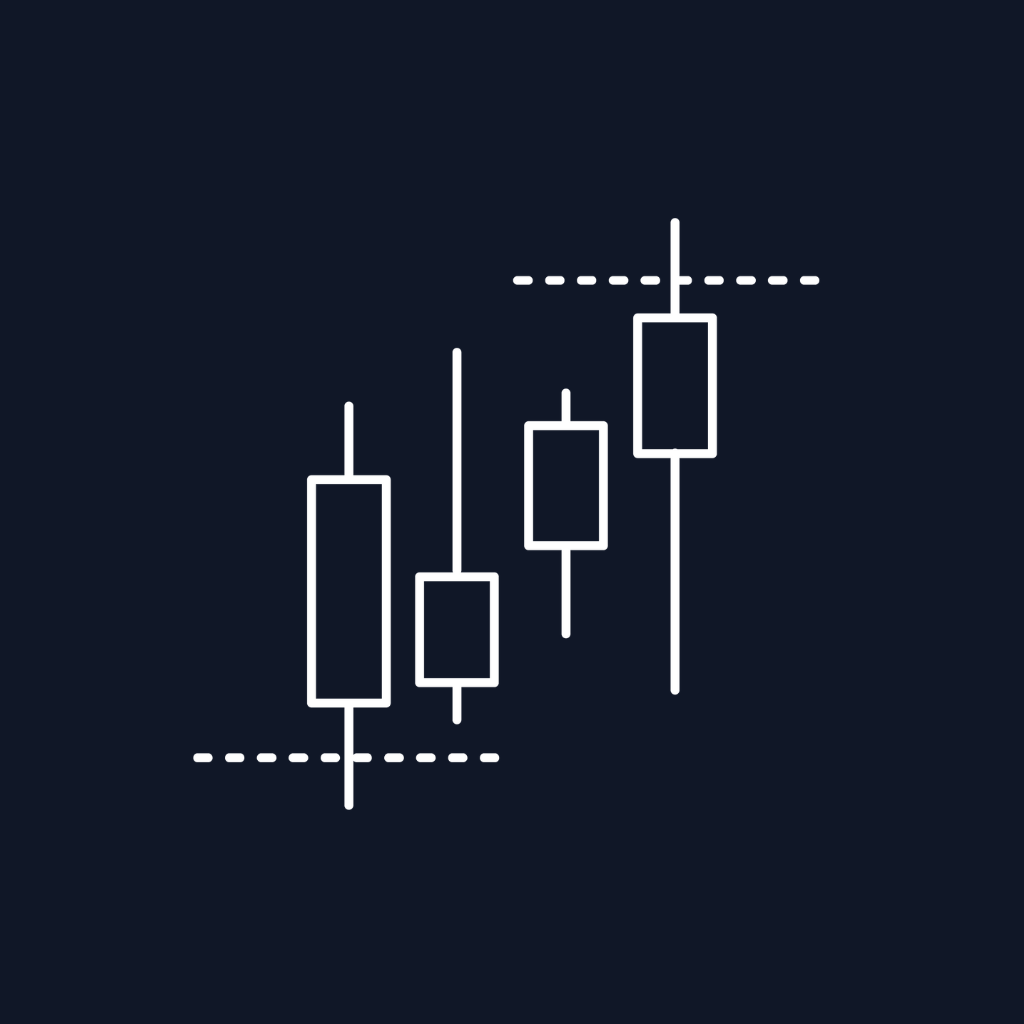
The lighter signature. Price forms a wick beyond the liquidity level on a single candle but the body fails to close through it. The wick pokes the stops resting just past the swing; the close-back stays on the original side. This is the same pattern SFP detects, and the trading logic is similar: failed breakout, immediate rejection, reversal likely.
Wick sweeps highlight weak breakouts. They're the institutional algorithms grabbing what stops they can without committing to a directional move beyond the level. Common at minor swing highs and lows; high-frequency, lower-conviction-on-average than the break-and-retest variant.
Break and Retest Sweep
The heavier signature. Price closes through the liquidity level (not just a wick — a body close), then on a subsequent bar returns to retest the level, forms a wick in the opposite direction at that retest, and reverses. The break commits institutions through the level; the retest is the engineered fill point.
Break-and-retest sweeps highlight strong setups where liquidity is tested and respected. The break confirms the level is in play; the retest with a wick in the opposite direction confirms the institutional position is being defended. These typically occur at more significant liquidity pools and produce larger follow-through moves than wick sweeps.
How the indicator detects both patterns
The Liquidity Sweeps indicator tracks every pivot high and low using a configurable swing length (default 5) and watches each one for either signature:
For wick sweep detection at a pivot high: the indicator monitors for a bar where High > Pivot AND Close < Pivot. The wick exceeded the level; the close didn't hold above it. When that fires, the indicator marks the bar, draws the level line, paints the sweep area (the box between the pivot and the wick extreme), and projects a confirmation line.
For break-and-retest sweep detection at a pivot high: the indicator first watches for a bar where Close > Pivot — that's the break. Once that's stored, it then watches subsequent bars for a retest where Low < Pivot AND Close > Pivot — price returned to the level and held above it on the close. The combination of break-then-respect is what qualifies the second signature.
You can run the indicator in three detection modes:
- Only Wicks: detects only the wick-sweep pattern. Highest signal frequency, similar to SFP behavior.
- Only Break and Retest: detects only the heavier signature. Fewer signals, more conviction per signal.
- Both: detects both patterns simultaneously, with distinct color coding for each.
This is the part that separates Liquidity Sweeps from a pure SFP detector — you can run it in Break-and-Retest-Only mode to focus exclusively on the higher-conviction signature, or combine both modes to get the full picture of how each level is being tested.
The confirmation line: the part most users skip
Every sweep — wick or break-and-retest — gets a confirmation line drawn from the opposite wick of the sweep bar. For a bearish sweep that hunts buy stops above a swing high, the confirmation line is drawn at the low of the sweep bar. For a bullish sweep that hunts sell stops below a swing low, the confirmation line is drawn at the high of the sweep bar.
The logic: a sweep that genuinely reverses will see price close through the confirmation line in the sweep direction. A sweep that fails — where price returns to the swept level and continues through it — is invalidated; the confirmation line never breaks, and the setup should be discarded.
Without the confirmation line, every wick beyond a swing looks tradeable, and you'd be taking signals on every false sweep the chart prints. With it, you have a binary filter: confirmation line breaks → real sweep, reversal in play. Confirmation line doesn't break → false signal, stay out.
This is the same discipline we covered in the SFP post — the wick is the signal, the confirmation line is the trigger. Trade only after the confirmation breaks.
Sweep Areas: the post-event retest level
Each sweep also paints a Sweep Area — the rectangular zone between the liquidity level and the wick extremity. This area persists on the chart and acts as a potential support or resistance zone for retests.
Why this matters: after a sweep, price frequently returns to retest the sweep area before continuing in the reversal direction. The first bounce off a fresh sweep area is often the highest-conviction re-entry point — the original sweep already confirmed institutional positioning at the level, and the retest gives you a second entry with a defined invalidation (a close back through the sweep area).
The indicator extends the sweep area forward bar-by-bar until price closes through the opposite edge, at which point the zone is marked as broken. You can configure whether to keep broken zones on the chart or remove them, and adjust the opacity of the fills independently for wick sweeps and break-and-retest sweeps.
How to actually trade Liquidity Sweeps
Three setups the indicator surfaces cleanly:
1. The confirmed sweep entry
The textbook setup. A sweep prints — wick or break-and-retest — the confirmation line draws, and price closes through it in the sweep direction. Entry is on the close of the confirming bar; stop goes beyond the wick that swept the level (above the bearish sweep wick or below the bullish sweep wick); target is the next structural level (a prior swing, an opposite-side liquidity pool from Buyside & Sellside Liquidity, or an Order Block from Order Blocks with Market Structure).
The discipline: wait for the confirmation. Trading the sweep before the confirmation line breaks is fading institutional momentum that may continue in the breakout direction. The confirmation is the filter that separates reversal sweeps from continuation breakouts.
2. The sweep area retest entry
The second-chance setup. A sweep confirms and the price moves in the reversal direction, then returns to test the sweep area before continuing. Entry on the retest with stop beyond the sweep area's opposite edge. This is often a cleaner risk-to-reward than the original sweep entry because the move has already proven itself once and you're entering on the pullback rather than the initial confirmation.
3. The break-and-retest sweep at a major liquidity pool
The highest-conviction setup. A break-and-retest sweep specifically — not a wick sweep — that occurs at a level identified by the Buyside & Sellside Liquidity indicator as a major liquidity pool (clustered pivots, not an isolated swing). The combination of the heavier sweep signature at a confirmed institutional level represents two independent indicators agreeing that the move is real. These are the setups worth waiting for.
Where this sits in the cluster
This is worth being explicit about, because Liquidity Sweeps overlaps mechanically with SFP and Buyside & Sellside but plays a distinct role:
- Buyside & Sellside Liquidity maps where the liquidity pools sit. Static structural map. Answers "where."
- SFP detects single-bar wick sweeps at any pivot. Single-pattern, single-bar timing tool.
- Liquidity Sweeps detects both wick sweeps and break-and-retest sweeps at any pivot, with sweep areas and confirmation lines tied to each event. Two-pattern event detection.
- CISD detects multi-candle delivery shifts that often occur right after a sweep confirms.
- Silver Bullet times the windows where sweep sequences are most likely to occur.
If you're running the full smart-money stack: Buyside & Sellside identifies the major pools to watch, Liquidity Sweeps catches the moment those pools get hit (with the confirmation line gating the entry), and CISD or the next reversal pattern times the precise reversal candle. Each tool answers a different question, and stacking them lets you grade setups by how many independent indicators agree.
Common mistakes that wreck sweep trading
Trading every sweep regardless of context. A wick sweep at a 5-minute pivot is not the same as a break-and-retest sweep at a daily liquidity pool. The indicator marks both; you need to weight them by the structural significance of the swept level.
Ignoring the confirmation line. The most common error. The sweep is the signal; the confirmation line break is the trigger. Trading on the sweep alone exposes you to false sweeps where the level holds and price continues in the breakout direction.
Running Wick-Only mode and ignoring the heavier signature. Wick sweeps are common but lower-conviction on average. If you're trading larger size or higher timeframes, Break-and-Retest-Only or Both modes produce setups that justify the position better than the wick-sweep frequency.
Missing the sweep area retest. Most traders see the initial sweep, take or miss it, and move on. The retest of the sweep area is often the cleaner entry and gets missed because attention has shifted. Leave the sweep area visible on the chart and watch for the second opportunity.
Setting swing length too short. A value of 2 or 3 produces sweeps on every minor pivot. Stay at 5 or higher for typical intraday charts. On 15-min and above, consider raising it to 7 or 10 to focus only on meaningful sweeps.
Trading sweeps against the higher-timeframe bias. Bearish sweeps in a strongly bullish daily structure tend to fail. The indicator detects the local pattern; you need to filter with the broader context. Use ICT Bias or Daily Range Zones for the directional bias overlay.
The bigger picture
Liquidity Sweeps is the event detector that pairs with the Buyside & Sellside map. Where Buyside & Sellside answers "where do the pools sit," Liquidity Sweeps answers "what just happened to that pool" — with two distinct pattern signatures, confirmation gating, and sweep area zones that surface both the initial entry and the retest re-entry.
The Liquidity Sweeps indicator handles the detection mechanically: tracking every pivot, watching for both wick and break-and-retest patterns, projecting confirmation lines, painting sweep areas, and managing the lifecycle of each event from formation through confirmation, retest, and eventual break. Used as the active event-detection layer on top of the structural Buyside & Sellside map, it transforms scattered swing-level reactions into a coherent read of which sweeps are real and which are noise.
Related Indicators
Liquidity Sweeps works best as part of the full smart-money stack:
- Buyside & Sellside Liquidity — maps the major liquidity pools where sweeps carry the most weight (covered in last week's post)
- Swing Failure Pattern — the dedicated single-bar wick-sweep detector with a volume filter (covered in our SFP post)
- CISD — catches the delivery shift in the candles immediately following a confirmed sweep (covered in our CISD post)
- ICT Silver Bullet — times the windows where sweep sequences most commonly occur (covered in our Silver Bullet post)
Disclaimer: Trading futures and other leveraged instruments involves substantial risk of loss and is not suitable for all investors. Past performance and indicator signals are not indicative of future results.