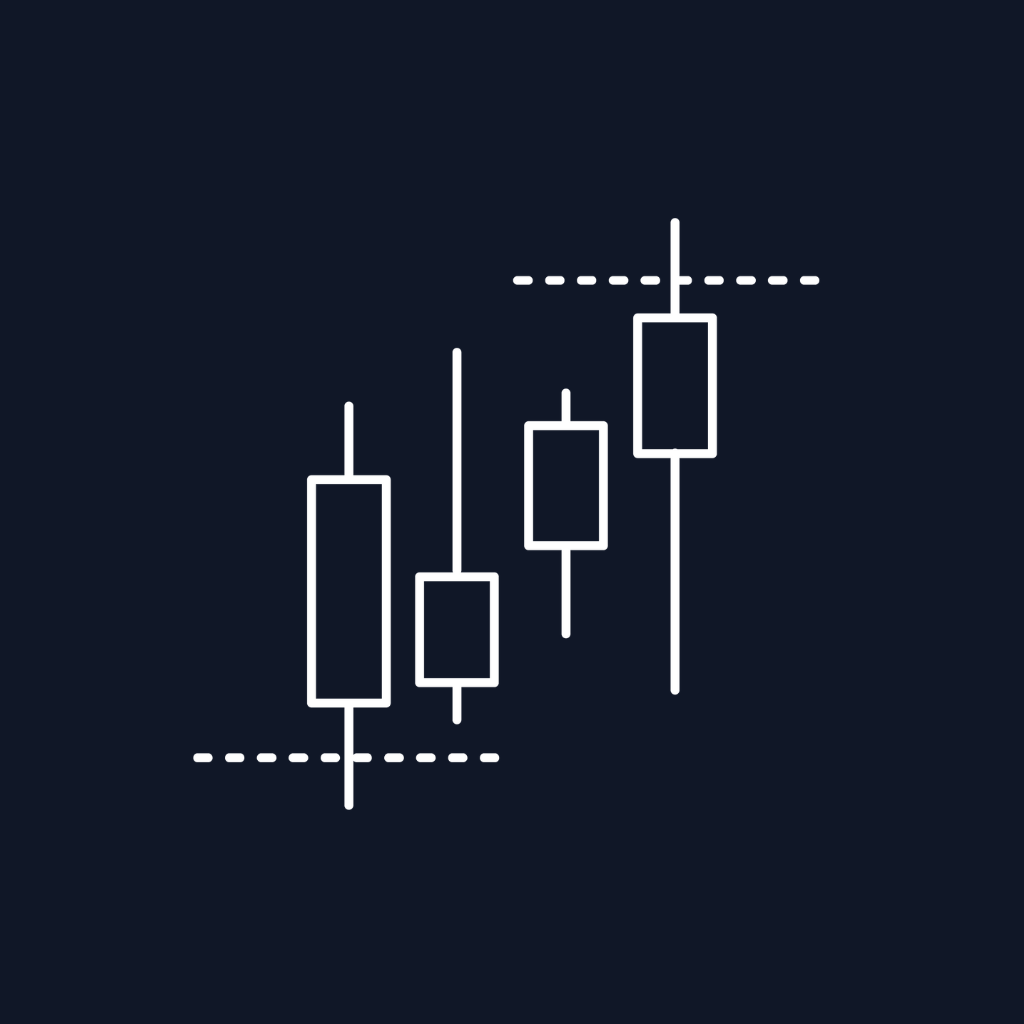

The Fair Value Gap is probably the most drawn and least understood construct in smart-money trading. The definition is three bars long and can be taught in a sentence, which is precisely the problem: it is easy enough to detect that almost every tool detects it, and the detection is the least valuable part.
We covered FVGs on this blog back in 2023, before the current product existed and before this series set its standard for depth. This is the rewrite. And the framing has changed: the question is no longer "where are the gaps" but "which of these gaps deserve my attention, and what happened inside them".
The definition, precisely
A Fair Value Gap is a three-bar formation where the first bar's wick and the third bar's wick do not overlap. The middle bar delivered price through a range so quickly that it left a band where one side of the market barely transacted.
For a bullish FVG: bar one's high sits below bar three's low. The zone between them — from bar one's high to bar three's low — is the gap. It sits below current price.
For a bearish FVG: bar one's low sits above bar three's high. The zone runs from bar three's high to bar one's low, and sits above current price.
The reasoning behind why these zones matter: in an efficiently delivered market, price spends time at every level, and both buyers and sellers get filled. A gap is evidence that didn't happen. The market moved through that range without two-sided participation, and the theory is that price tends to return to rebalance it.
That is the whole textbook. Notice how much it doesn't tell you: not which gaps matter, not whether a given gap is likely to hold, not what to do when price arrives. Those are the questions Fair Value Gap Plus is built around.
Problem one: most gaps are noise
Apply the three-bar rule mechanically to a 1-minute chart and you will find dozens of gaps per session, most of them a tick or two wide. They satisfy the definition perfectly and mean nothing. They exist because of the mechanics of bar construction, not because of any imbalance a participant would recognise.
The fix is ATR-based validation. Each detected gap is measured against current average true range, and gaps below the threshold are discarded before they ever reach your chart.
Using ATR rather than a fixed tick value matters more than it appears. A gap that is structurally significant during a quiet overnight session would be trivial during a news release. A fixed threshold is either too loose in one regime or too tight in the other. ATR moves with the market, so one setting stays sensible across both.
This single filter changes the character of the tool. Instead of a chart papered over with boxes, you get the handful of imbalances large enough to have been created by real displacement.
Problem two: the box tells you nothing about participation
Two gaps can look identical — same size, same shape, same position relative to structure — and be completely different events. One was created by genuine institutional displacement with heavy one-sided volume. The other was a thin drift through a dead period with almost no participation at all.
A box cannot tell them apart. Volume can.
Fair Value Gap Plus renders a volume profile inside each gap and computes delta volume within the zone. That gives you two things a standard FVG indicator cannot:
- Distribution. Where inside the gap did the transacting actually happen? A gap with its volume concentrated near one edge behaves differently from one with volume spread evenly.
- Delta. Was the displacement genuinely one-sided? Strong positive delta inside a bullish gap is consistent with real buy-side aggression. Flat delta suggests price simply drifted through.
In practice this is the main filter traders end up using once they have it. Gap size tells you whether an imbalance is structurally meaningful; delta inside the gap tells you whether anyone meant it.
Fulfillment: what counts as filled
"The gap got filled" sounds unambiguous and isn't. There are at least three defensible readings, and the indicator supports all of them:
- Wick-based. Any wick into the zone counts. Most sensitive; gaps fill often.
- Close-based. A bar must close inside the zone. The market accepted the price rather than probing it.
- Level-based. Price must reach a specific level — commonly the midpoint (the consequent encroachment) or the far edge.
These are not interchangeable, and mixing them is a real source of confusion. A trader using wick-based fills sees a market where gaps are almost always resolved quickly. A trader using close-based fills on the same chart sees gaps persisting for hours. Both are looking at the same price data. Pick one definition and stay with it, or your read of "how often do gaps fill" will be incoherent.
Mitigation signals and next-unfilled projections
The indicator fires a mitigation signal in real time when price returns into a gap. That is the actionable moment — the gap has been sitting there as a level, and price has now arrived.
More interesting are the forward-looking plots. BullHiNext and BearLoNext identify the closest unfilled gap in each direction. Because the market has a tendency to seek unresolved imbalance, those levels function as structural draws: not a prediction, but a statement about where an unrebalanced zone still sits.
For automation this is genuinely useful. A strategy that takes profit at "the next unfilled bearish FVG" is using a target the market itself defined, and one that moves as new gaps form and old ones fill. Compare that to a fixed 20-tick target, which knows nothing about structure.
Active and filled gap states, delta values, and all zone boundaries are exposed as plots for Strategy Builder, with no NinjaScript required. BloodHound and Blackbird integration is supported.
Higher timeframe gaps on an execution chart
A 4-hour FVG is a materially different object from a 1-minute FVG, and the difference isn't just size. The 4-hour gap represents displacement that took hours to create and involves far more participation. It tends to matter more.
The indicator can render higher-timeframe gaps directly on your execution chart, including tick-based calculation for traders working on non-time charts. The practical value: you execute on a 1-minute chart while seeing the 4-hour imbalances as levels, without flipping timeframes and without eyeballing where a gap from another chart would sit.
Common mistakes
Trading every gap. The most common failure by a wide margin. Gaps are abundant. Filtered by ATR, confirmed by delta, and aligned with higher-timeframe bias, they are selective. Unfiltered, they are a reason to be in the market constantly.
Treating a gap as an entry rather than a zone. A gap is an area where a reaction is plausible. It is not a trigger. Price entering a bullish FVG is not a buy signal on its own — it needs something confirming the reaction, whether that is a CISD, a rejection candle, or a shift in delta.
Ignoring what happens after a gap fails. A gap that gets closed through doesn't stop existing — it inverts, and the level often matters again from the other side. That is the subject of last week's post on Inversion Fair Value Gaps, and it is the natural continuation of this one.
Buying gaps against the higher-timeframe draw. A bullish FVG under bearish daily bias is a level price is likely to trade through on its way somewhere lower. ICT Bias exists to filter exactly this case.
Switching fill definitions to suit the outcome. Using wick-based fills when you want the gap to be filled and close-based when you want it still open is a way of never being wrong and never learning anything. Commit to one.
What actually makes a gap tradeable
Strip it back and there are four questions, in order:
- Is the gap large enough relative to current volatility to be structural? (ATR filter)
- Did real one-sided participation create it? (delta inside the gap)
- Does it align with the higher-timeframe directional draw? (bias)
- Is something confirming the reaction now that price has arrived? (execution tool)
A box on a chart answers none of those. The reason FVGs have a reputation for being unreliable is that most traders act on the box and skip the four questions.
Disclaimer: Trading futures and other leveraged instruments involves substantial risk of loss and is not suitable for all investors. Past performance and indicator signals are not indicative of future results.