
Every experienced trader has some version of the same habit: execute on a low timeframe, periodically flip up to the 4-hour or the daily to check that the bigger picture still agrees, flip back down.
It works, and it has two costs. The obvious one is that you're not watching your execution chart while you're looking at another one. The subtler and more expensive one is that the higher-timeframe candle is still forming while you're down on the 1-minute, and you have no visibility into how it's developing. You check at 11:00, see a benign 4-hour candle, go back down — and by 11:40 that candle has become a bearish engulfing you didn't watch happen.
HTF Reversals removes the flip entirely: higher-timeframe reversal patterns and candle structure drawn on the chart you're already looking at.
The two pattern families
The indicator detects three patterns from your chosen higher timeframe, in two families.
Engulfing candles
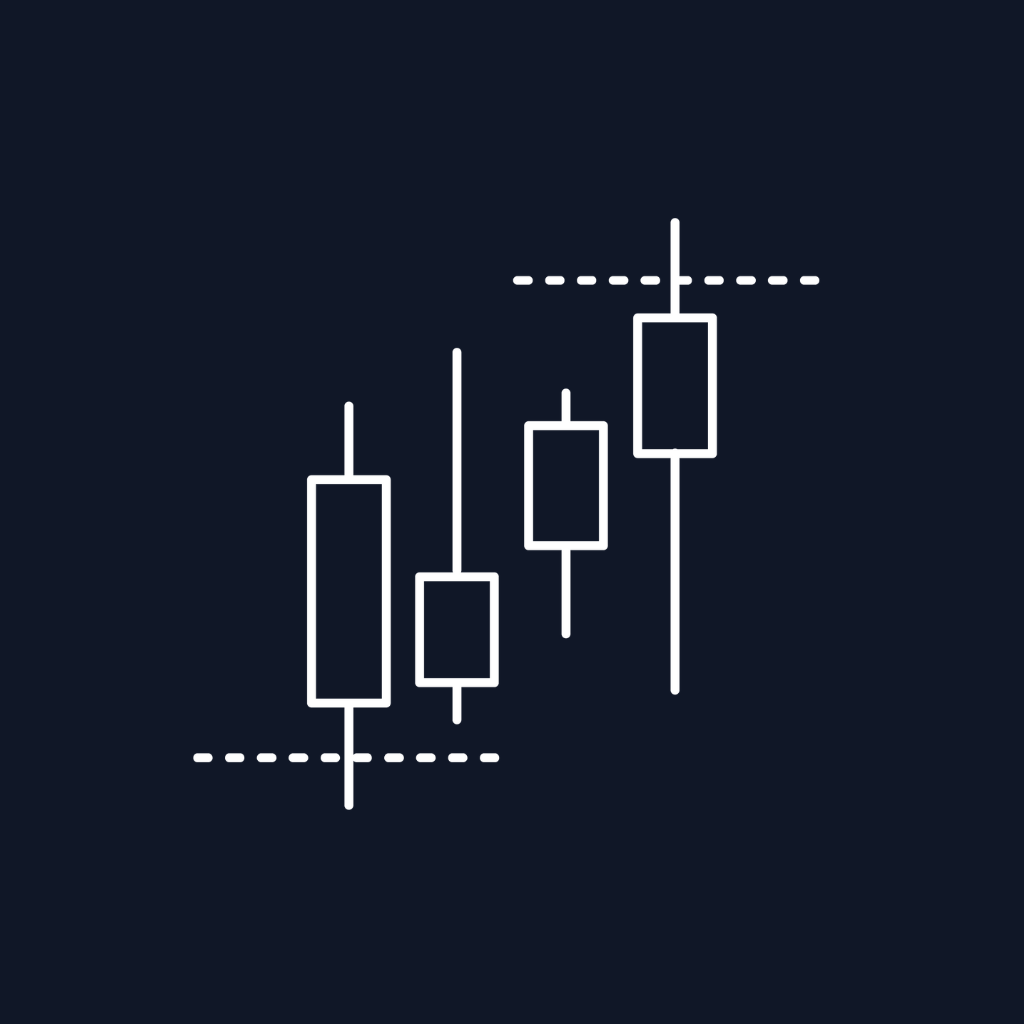
A bullish engulfing candle opens below the prior candle's close and closes above its open, swallowing the previous range. Bearish engulfing is the mirror.
What makes engulfing meaningful on a higher timeframe is what it represents in terms of time and participation. A 4-hour bullish engulfing means that over four hours, buyers absorbed everything the previous four hours of selling produced and closed above where that selling began. That's a lot of transacted volume changing hands in one direction. The same pattern on a 1-minute chart can be produced by a single order.
Pin bars: hammer and shooting star
A hammer has a long lower wick and a small body near the top of its range — price was pushed down significantly and rejected. A shooting star is the inverse.
Pin bar detection is where a lot of indicators get sloppy, because "long wick" is subjective. This one uses strict wick-to-range ratio rules rather than approximate pattern matching. That matters: loose pin bar logic flags every candle with a slightly longer wick, which is most candles, which makes the signal worthless. A defined ratio threshold means a hammer is a hammer by a stated rule you can reason about.
Structured zones, not arrows
Worth being explicit, because it's a design decision that surprises people: this indicator does not print buy and sell arrows.
When a pattern is detected, it draws the full structure — the candle's total range, its body area, its wick, and a label. You get the anatomy of the reversal as a zone on your chart rather than a directive.
The reasoning is that the pattern's location is where the tradeable information lives. A bullish engulfing has a body whose top edge is a specific price, and price reclaiming that edge on your execution chart is a rule you can act on. The wick low is a different price and a different rule. Collapse all of that into one arrow and you've thrown away the levels that make the pattern usable.
PO3: watching the candle build
The feature that solves the original problem is the Power of Three projection.
Enable it and the developing higher-timeframe candle is projected to the right of price on your chart, updating live — with optional labels for its open, high, low, close, and running delta.
PO3 refers to the three phases a candle passes through: accumulation, manipulation, and expansion. Any HTF candle, viewed while forming, is somewhere in that sequence. A 4-hour candle that is ninety minutes old and has a long lower wick with price now near its high is telling a specific story — the low was rejected and buyers are in control of this candle so far. That's information that simply does not exist on your 1-minute chart, and it isn't visible on the 4-hour either, because there you see a finished candle only after it finishes.
The running delta alongside it answers the participation question: is the developing candle's direction backed by aggressive one-sided flow, or is it drifting?
This turns higher-timeframe analysis from a periodic check into something continuous. You aren't waiting for the 4-hour candle to close to learn what it did.
Non-repainting, with a caveat that matters
Patterns confirm only after the higher-timeframe candle has fully closed. Once confirmed, they're locked — no redrawing, no disappearing. This holds under both Calculate.OnBarClose and OnEachTick, which is not something every multi-timeframe indicator can claim.
The caveat is one of interpretation rather than behaviour: the PO3 projection does change continuously, because it's showing you a candle that hasn't finished. That's the entire point of it. But a developing candle that currently looks like a bullish engulfing may not close as one. PO3 is live context; the confirmed patterns are the signals. Treating the projection as a confirmed pattern is a self-inflicted problem.
Choosing the higher timeframe
You can select minute, hourly, daily, weekly, or tick-based intervals. Common configurations:
- Scalping on 1–5 minute: 15-minute or 1-hour as the HTF
- Intraday on 5–15 minute: 1-hour or 4-hour
- Swing on 1–4 hour: daily or weekly
The useful heuristic is roughly a 10x to 20x ratio. Too close together and the HTF adds no perspective — a 5-minute HTF on a 1-minute chart is barely a different view. Too far apart and the patterns are so infrequent that they stop being actionable within your holding period. A daily engulfing is real information, but if you're flat by 4:00 PM it may not be information you can use.
Automation
Pattern type, direction, and the HTF OHLC values are all exposed as plots for Strategy Builder, NinjaScript, BloodHound and Blackbird.
The HTF OHLC plots are the ones worth dwelling on. Having the higher timeframe's open, high, low and close as live numbers on your execution chart lets a strategy write conditions across timeframes without any multi-series bar-indexing work — which is otherwise one of the genuinely fiddly parts of NinjaScript. Conditions like "price is above the 4-hour open and a bullish HTF engulfing was confirmed" become straightforward.
Practical note: there are max-pattern limits and chart controls for managing object count. Over a long session with a low HTF setting, drawn objects accumulate, and these controls exist to keep that from degrading performance. Worth setting deliberately rather than discovering later.
Where it fits
HTF Reversals is a context tool, and it overlaps deliberately with the bias layer:
- With ICT Bias: bias gives you the directional draw from previous-period levels; HTF Reversals gives you candle-level evidence of a turn. Agreement between them is a strong context read; disagreement is a reason to wait.
- With execution tools: a confirmed HTF bullish engulfing establishes the direction; an Order Block or FVG on the low timeframe gives you the entry inside it.
- With ICT Macros: PO3 shows you which phase the HTF candle is in; macros show you which phase the intraday algorithm is in. Two resolutions of the same accumulation-manipulation-expansion idea.
Common mistakes
Trading the PO3 projection as a confirmed pattern. The projection is a candle in progress. It will change. Use it for context and act on confirmed patterns.
Choosing an HTF too close to your execution timeframe. A 5-minute HTF on a 3-minute chart provides essentially no additional perspective while adding objects to your chart.
Expecting arrows. The tool draws zones and exposes plots on purpose. If you want a signal, you build the rule — which also means you know what your rule is.
Taking HTF reversals without a lower-timeframe entry. A daily bullish engulfing is a large zone. Buying anywhere inside it because the pattern is bullish exposes you to the full range. The pattern is the reason; the execution tool is the entry.
Letting objects accumulate all session. Set the max-pattern limit. Performance degradation from thousands of drawn objects gets blamed on the indicator when it's a configuration choice.
The workflow it enables
Top-down analysis has always been the recommended approach and has always been awkward to actually do, because the tooling forced you to choose which timeframe you were looking at. Overlaying the higher timeframe onto the execution chart — patterns, levels, and the developing candle — makes it one view instead of two.
Disclaimer: Trading futures and other leveraged instruments involves substantial risk of loss and is not suitable for all investors. Past performance and indicator signals are not indicative of future results.