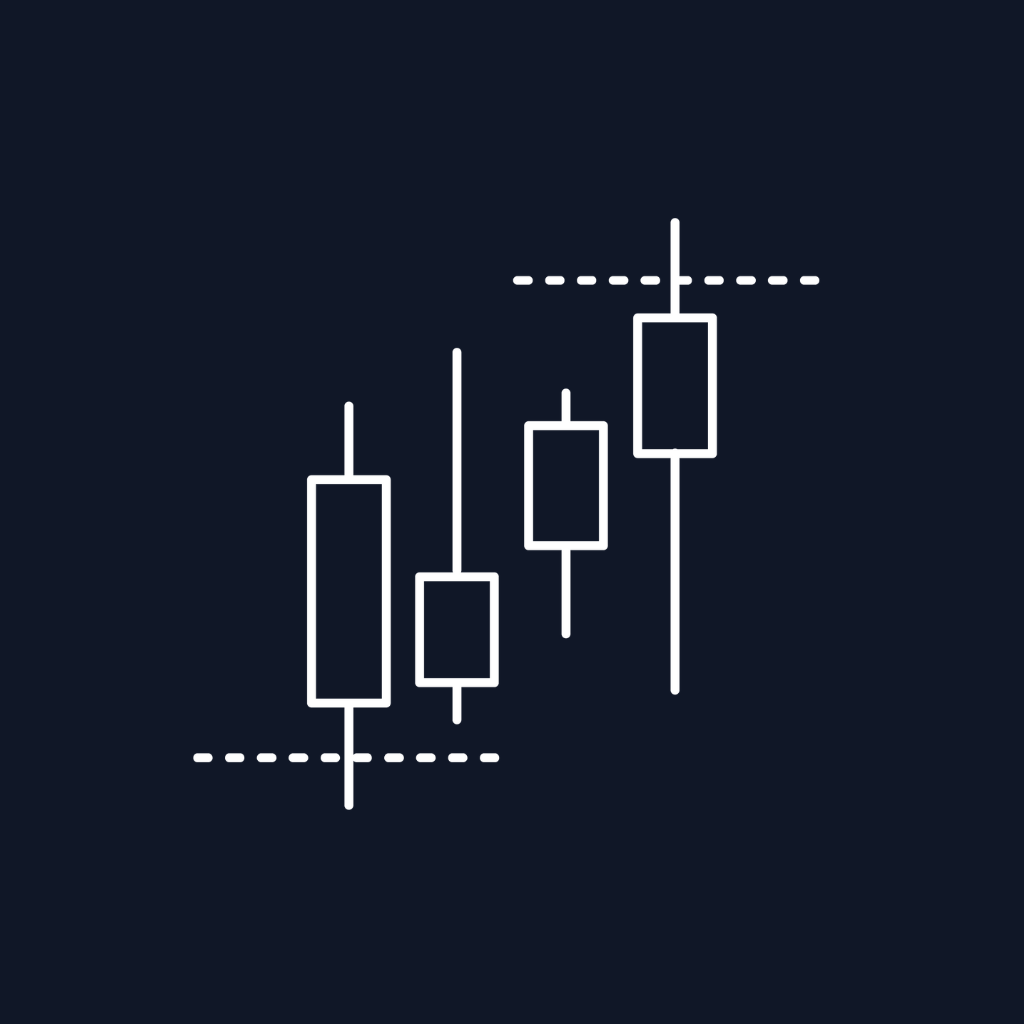

Give ten traders the same chart and ask each to draw the trendline. You'll get ten different lines. Some connect wicks, some connect bodies. Some use two touches, some insist on three. Some include the outlier low; some call it noise and skip it.
None of them are wrong, which is the problem. "Draw the trendline" is not a well-defined instruction, and every downstream conclusion — whether the line held, whether it broke, whether the break was valid — inherits that ambiguity. Two traders can watch the same candle and disagree about whether a breakout happened, because they're looking at different lines.
This series has covered a lot of ICT-specific structure. Trendlines are older and more universal than any of it, and they suffer from the subjectivity problem worse than anything else on a chart. Trendlines with Breakouts addresses it by replacing the drawing decision with a rule.
ATR-based slope logic
The indicator detects and plots upper and lower trendlines automatically, using ATR-based slope calculation rather than fixed angles.
That choice matters more than it sounds, so it's worth working through why. A trendline is a slope, and slope has units — price per bar. But the appropriate price-per-bar changes enormously with volatility. In a quiet overnight session a trend might advance two ticks per bar; during a news-driven expansion, forty. A fixed slope tolerance calibrated to one regime is meaningless in the other: too tight and every trend line breaks immediately, too loose and nothing ever qualifies as a break.
ATR-based slope makes the calculation volatility-relative. Trendlines run flatter in quiet markets and accommodate wider swings in volatile ones, because the definition of a meaningful deviation scales with how much the market is currently moving. Same setting, sensible behaviour across regimes.
This is the same reasoning behind ATR filtering in the Fair Value Gap and IFVG tools, and it recurs across the catalog for good reason: any threshold expressed in absolute price terms is wrong most of the time.
The false breakout problem
Automatic trendlines solve the drawing problem. They don't solve the harder one, which is that most trendline breaks fail.
And the reason connects directly to last month's post on equal highs and lows. A well-established trendline is a visible level that a lot of participants are watching. Watched levels accumulate orders: breakout buy stops above a descending line, protective stops below an ascending one. That makes a trendline a liquidity pool with a slope — and pools get raided.
So the single break candle is the least reliable moment in the sequence. It's the moment the resting orders get triggered, which is precisely why it happens whether or not the trend is actually turning.
N-candle confirmation
The indicator's answer is a confirmation window: after a break occurs, it waits N candles for follow-through before confirming the move as valid.
The logic is straightforward and rests on the mechanism above. A raid produces one decisive candle through the line and then price returns inside. A genuine structural break produces the initial move and continued acceptance on the far side. Requiring N candles of follow-through separates them, because it asks a question the raid can't answer: does price stay there?
What you pay for it is entry price. By the time N candles have printed, the move has extended. That's a real cost, not a rounding error, and it's why the indicator exposes both events separately rather than choosing for you.
Four plots, and why the split matters
The signals are separated into four independent plots:
-
Upper break— price broke the upper trendline -
Upper confirmation— that break survived N candles -
Lower break— price broke the lower trendline -
Lower confirmation— that break survived N candles
Keeping break and confirmation as separate plots is the design decision that makes this genuinely useful for automation, because it lets a strategy use both stages for different purposes:
- Trade the break, manage with the confirmation. Enter on the initial signal for the better price; if confirmation doesn't arrive within N candles, exit. The confirmation becomes a time-based invalidation rather than an entry.
- Trade the confirmation only. Ignore the break entirely. Fewer trades, worse prices, fewer failed breaks.
- Use one direction as a filter. An upper break on a long position is a reason to tighten, not a reason to enter short.
- Scale. Partial size on the break, add on confirmation.
A single combined signal supports the second of these and none of the others.
Non-repainting, and why that's less trivial here
Trendlines and signals are fixed once formed.
This is worth calling out because automatic trendline tools are a category where repainting is common and easy to miss. A naive implementation refits its lines as new pivots arrive, which means the trendline you see on historical bars is the best-fit line drawn with knowledge of what came next. Backtest that and the results are meaningless — you're testing a line that couldn't have existed at the time.
Fixed-once-formed means the historical trendlines on your chart are the lines the indicator actually plotted at the time, and the breakout signals are the signals it actually fired. Backtest results and forward results describe the same tool.
Where it fits
Trendlines are diagonal structure, and almost everything else in the stack is horizontal. That makes this genuinely additive rather than redundant:
- Confluence with horizontal levels. A descending trendline intersecting a bearish Order Block is two independent structures converging at one price and one time. Those intersections are the highest-quality trendline setups available, and they're transient by nature — the diagonal only sits at that price briefly.
- Session-filtered breakouts. A trendline break during the London Open killzone has liquidity behind it. The same break at midday is far more likely to be a drift through a thin book. The killzone session flag is a one-condition filter on breakout quality.
- Breaks during expansion macros. ICT Macros classifies windows as manipulation, accumulation or expansion. A breakout inside an expansion macro is aligned with the phase; one inside a manipulation macro is quite likely to be the raid itself.
- Direction from bias. Take breaks aligned with the higher-timeframe draw and skip the rest.
- Volume confirmation. The product notes recommend pairing with volume tools, and it's sound: a break through a low-volume node travels easily, while a break into a high-volume node from Volume Profile tends to stall.
Common mistakes
Trading every break without confirmation. The confirmation logic exists because the raw break fails often. Using the tool while ignoring its main filter is choosing the worst of both worlds — automated detection of the least reliable signal.
Setting N too high. Long confirmation windows filter almost everything, including the real moves, and by the time confirmation arrives the entry is far from the level. There's a middle ground and it's worth finding empirically on your instrument.
Not tuning ATR for the instrument. ES and CL have very different volatility profiles. The slope logic adapts to volatility automatically, but the ATR settings themselves should reflect the instrument.
Treating the trendline as the reason. A trendline is one structure among several. A break that coincides with nothing else is a break of a line you drew — or rather, that an algorithm drew.
Assuming automatic means objective in the strong sense. It's consistent, which is different. The indicator applies one rule identically every time — valuable precisely because it's repeatable and backtestable — but it's still a rule someone chose. Consistency is the win here, not the discovery of the true trendline.
What's actually gained
Not a better trendline — a repeatable one. Every trendline on your chart was produced by the same logic, every break was evaluated by the same test, and the historical record is the record of what the tool actually did rather than what it would have done with hindsight.
That's what makes a discretionary technique into something you can test, automate, and hold to account.
Next week: the capstone — which tool for which market condition, and how the whole stack fits together.
Disclaimer: Trading futures and other leveraged instruments involves substantial risk of loss and is not suitable for all investors. Past performance and indicator signals are not indicative of future results.