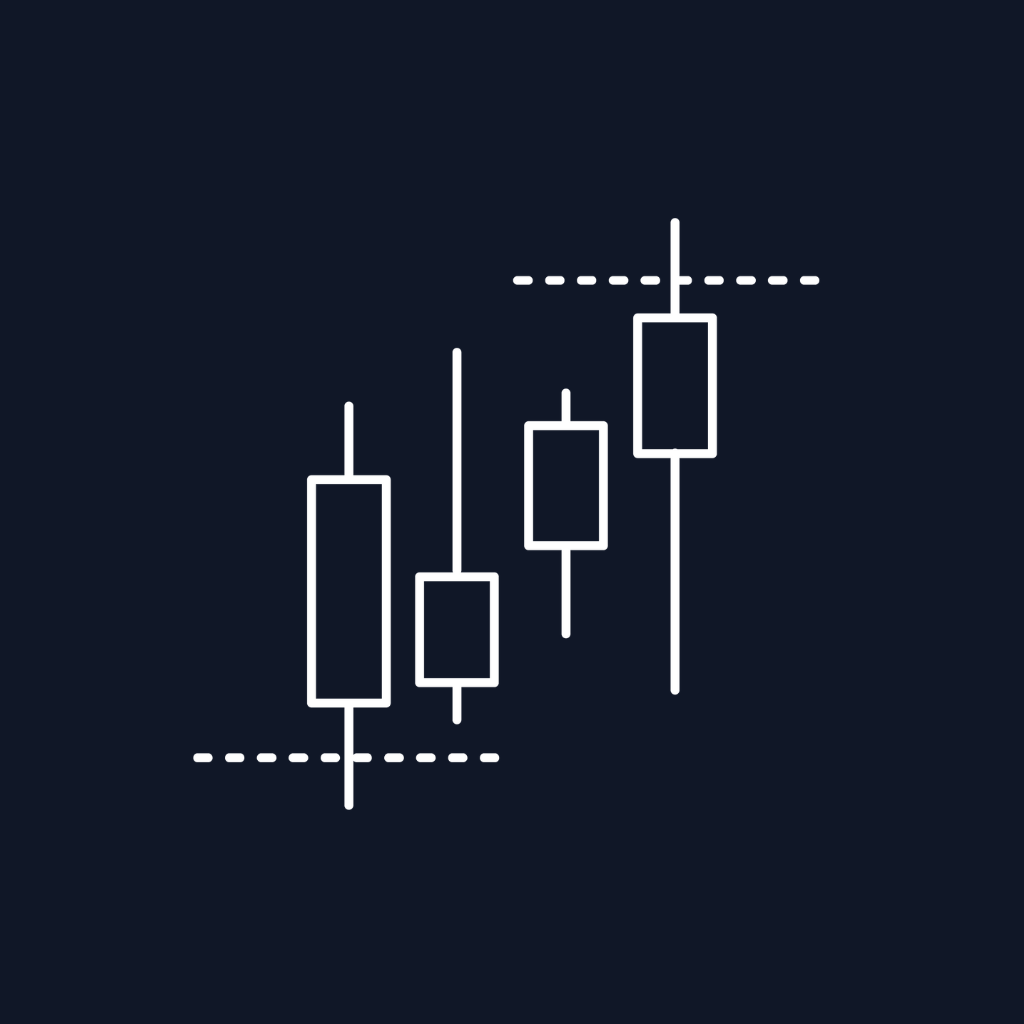

Two highs at roughly the same price. Classical technical analysis has a name for this — double top — and a prescription: resistance, expect rejection, sell it.
The smart-money read inverts that almost entirely. A pair of equal highs isn't primarily resistance. It's a liquidity pool. And a liquidity pool is not somewhere price avoids — it's somewhere price is drawn to.
Getting this the wrong way round is one of the more expensive misreads available, so it's worth working through carefully. That's what Equal Highs and Lows maps.
Why a flat level accumulates orders
Follow the order flow rather than the pattern.
Price rallies to a high and pulls back. That high is now a visible, unambiguous reference. Price rallies again and stalls at almost exactly the same price. Now consider who has done what:
- Breakout traders have placed buy stops just above the level, waiting for the break
- Traders who shorted the first high have their protective stops just above it too
- Traders who shorted the second high have added more stops in the same place
- Anyone long from lower has a take-profit near the level
Every one of those is a buy order resting slightly above a single, obvious price. That's not resistance in any meaningful sense — it's a concentration of guaranteed fills.
Now think about a large participant who needs to sell size. Selling into thin air moves the market against them. What they need is a burst of buying to sell into. There is a known pool of buy orders sitting twelve ticks above current price. Pushing price up into it triggers all of them at once, producing exactly the buying pressure required to fill a large sell order at a good average price.
Price goes up to the equal highs, takes them out, and then reverses hard. Not because resistance failed and then re-asserted — because the move above the level was the point.
Same mechanism inverted at equal lows: sell stops cluster below, and a participant needing to buy size pushes down into them.
Pivot-based detection, and why it matters
The obvious way to find equal highs is to scan for any two highs within some tolerance of each other. On a 1-minute chart that produces hundreds of matches, most of them adjacent candles that happen to top out similarly. None of those are liquidity pools, because nobody was watching them.
The indicator only compares confirmed pivots — highs and lows that are structurally significant, with enough bars either side to qualify as swings. That constraint is what makes the output meaningful: a level only becomes a liquidity pool if enough participants recognised it as a level in the first place, and pivot significance is a reasonable proxy for that.
Two settings control the behaviour:
- Pivot lookback — how many bars either side define a swing. Governs how significant a high must be to be considered at all.
- Threshold — how close two pivots must be to count as "equal". They are almost never identical to the tick, so this tolerance is doing necessary work.
Tuning guidance is straightforward: tighter threshold and shorter lookback for scalping, wider threshold and longer lookback for swing trading. The mistake is setting them once and then changing timeframes without revisiting them.
Persistent levels: study the sweeps
The indicator keeps EQH and EQL lines on the chart after they've been broken.
This is a deliberate design choice and an unusually useful one. Most tools clean up after themselves — level taken, level removed. But the historical record of how price interacted with each pool is precisely what you want to study. Did the sweep reverse immediately? Did price sweep, close above, and continue? How far past the level did it typically extend before turning?
Those questions have instrument-specific answers, and the only way to develop a feel for them on your market is to be able to look back at fifty of them. A chart that erases each level as it's consumed makes that impossible.
The plots
Three things are exposed for automation:
-
Signal—-1when an EQH is detected,+1when an EQL is detected -
LastEQH/LastEQL— the price values of the most recent equal high and low - Active level tracking — which levels are currently in play
The price-value plots are the ones that unlock real strategy logic. Because LastEQH is a live number, a strategy can reason about distance: how far is price from the nearest liquidity pool above? That's a target, a risk reference, and a filter all at once. A long entry twenty ticks below a known EQH has a specific, structural obstacle in front of it — and the strategy can know that rather than discovering it.
Note that the hidden plots update slightly earlier than the drawn levels, which are held back until pivot confirmation. For automation that earlier read is usually what you want; just be aware the two aren't identical by a bar or two.
Using it with the rest of the stack
EQH/EQL answers "where is the liquidity?" It doesn't answer when it gets taken or what happens after. Those are other tools' jobs:
- The sweep itself — Liquidity Sweeps and SFP detect the event. EQH/EQL told you in advance which level was the likely target.
- The reversal — a CISD immediately after a sweep of equal highs is the delivery shift that confirms the raid is done.
- The destination — an inverted FVG or an Order Block just past the pool gives the reversal somewhere specific to react from.
- The timing — a manipulation macro is when a sweep is most likely. Combining ICT Macros with EQH/EQL gives you both the window and the target.
- The confirmation — an SMT divergence at the swept level says the peer instrument didn't confirm the break. Strong evidence for a raid rather than a genuine breakout.
Common mistakes
Shorting equal highs as resistance. The central error. You are placing a stop inside the exact pool the market is likely to target. If you want to trade the reversal, wait for the sweep and let the level be taken first — then trade the failure.
Buying the breakout of equal highs. The opposite error, equally punished. Buy stops above equal highs are the liquidity; a break of that level is as likely to be the raid as the beginning of a move. Wait for acceptance above, not just penetration.
Setting the threshold too wide. Widen the tolerance enough and any two highs within a broad range become "equal". The specificity is what gives the level its power — an obvious price is one everyone sees at the same number.
Treating every pool as equally important. An EQH from two pivots on a 1-minute chart holds far less liquidity than one from three pivots on the hourly. The indicator marks both; judging their relative weight is still your job.
Removing swept levels from the chart. Persistence is a feature. The archive of past sweeps on your instrument is how you learn its behaviour.
The reframe
Classical analysis treats a flat level as a wall. The liquidity view treats it as a magnet. Both descriptions predict price arriving at the level; they disagree completely about what happens on the way there and about where your stop should sit.
Price doesn't move randomly. It moves toward liquidity — and equal highs and lows are the most visible liquidity on any chart.
Disclaimer: Trading futures and other leveraged instruments involves substantial risk of loss and is not suitable for all investors. Past performance and indicator signals are not indicative of future results.