Scalper's Hub

Equal Highs and Lows: Why Flat Levels Attract L...
Two highs at the same price look like resistance. They're better understood as a stop cluster — a pool of resting orders sitting at a level everyone can see. Which...
Equal Highs and Lows: Why Flat Levels Attract L...
Two highs at the same price look like resistance. They're better understood as a stop cluster — a pool of resting orders sitting at a level everyone can see. Which...

ICT Macros: The 20-Minute Windows Inside Every ...
A killzone is three hours wide. The activity inside it isn't spread evenly — it clusters into short, repeating windows. Macros mark those windows and, more usefully, classify what kind...
ICT Macros: The 20-Minute Windows Inside Every ...
A killzone is three hours wide. The activity inside it isn't spread evenly — it clusters into short, repeating windows. Macros mark those windows and, more usefully, classify what kind...

ICT Killzones: The Four Session Windows That Sh...
Most traders don't have a strategy problem. They have a timing problem. The same setup taken during the London Open and during the New York lunch hour is not the...
ICT Killzones: The Four Session Windows That Sh...
Most traders don't have a strategy problem. They have a timing problem. The same setup taken during the London Open and during the New York lunch hour is not the...

Divergence Trading Explained: Regular, Hidden, ...
Divergence has a bad reputation, and it's earned — on a single oscillator it fires constantly and resolves rarely. The fix isn't a better oscillator. It's requiring several of them...
Divergence Trading Explained: Regular, Hidden, ...
Divergence has a bad reputation, and it's earned — on a single oscillator it fires constantly and resolves rarely. The fix isn't a better oscillator. It's requiring several of them...

Fair Value Gaps Explained: Trading Price Imbala...
A Fair Value Gap is a three-bar imbalance — easy to define, easy to draw, and almost useless on its own. What turns a gap into a decision is knowing...
Fair Value Gaps Explained: Trading Price Imbala...
A Fair Value Gap is a three-bar imbalance — easy to define, easy to draw, and almost useless on its own. What turns a gap into a decision is knowing...

Inversion Fair Value Gaps: What Happens After a...
Most FVG indicators stop working the moment a gap gets filled. But a broken imbalance doesn't vanish — it flips. A bullish gap that fails becomes resistance; a bearish gap...
Inversion Fair Value Gaps: What Happens After a...
Most FVG indicators stop working the moment a gap gets filled. But a broken imbalance doesn't vanish — it flips. A bullish gap that fails becomes resistance; a bearish gap...
Featured collection
-
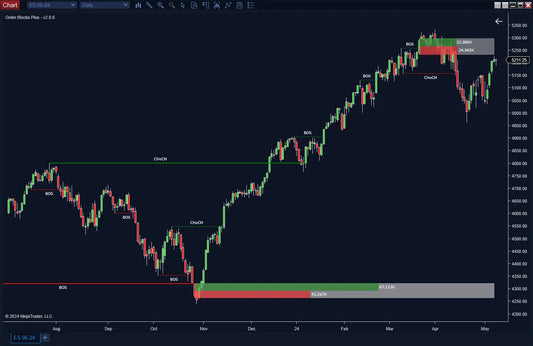
Order Blocks with Market Structure
Regular price $326.00 CADRegular priceUnit price per -
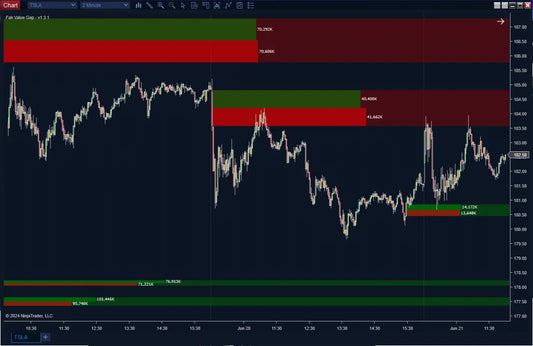
Fair Value Gap Plus
Regular price $269.00 CADRegular priceUnit price per -
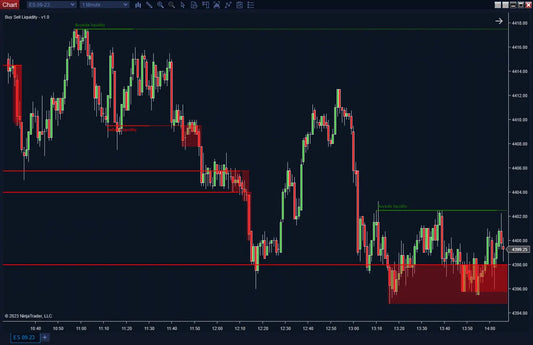
Buyside & Sellside Liquidity
Regular price $212.00 CADRegular priceUnit price per -
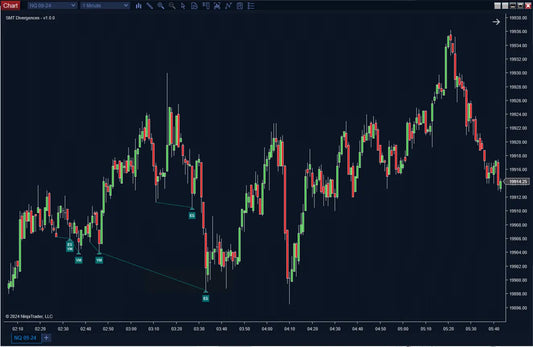
SMT Divergences
Regular price $269.00 CADRegular priceUnit price per