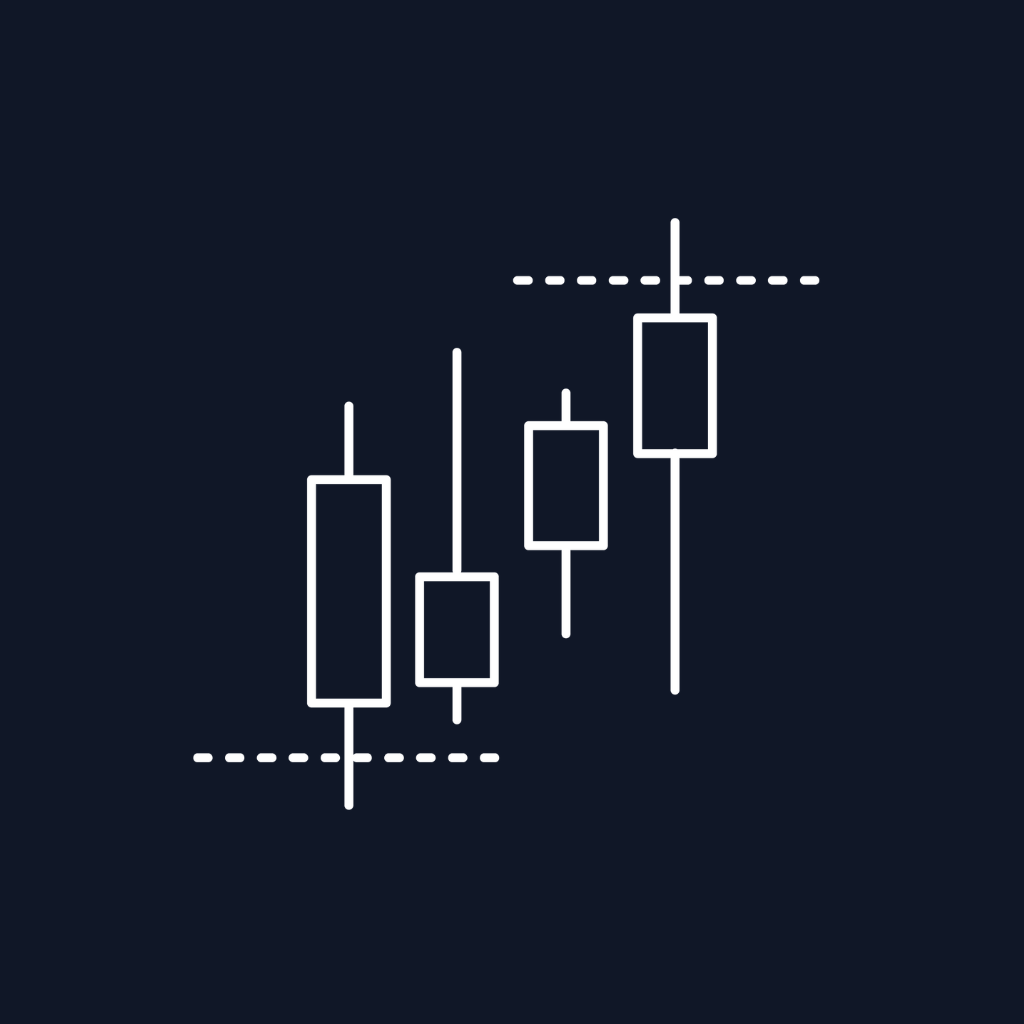

Most traders who hear about Order Blocks pick up the textbook definition — "the last opposing candle before a significant move" — and go straight to the chart looking for them. Within a week, they've drawn dozens of boxes. Within a month, they've lost faith in the concept because price keeps ignoring those boxes.
The problem isn't Order Blocks. The problem is treating them as shapes instead of as what they actually are: visible footprints of institutional positioning, validated by what price does next. A box on your chart with no structural context is just a box. A box that formed before a clean break of market structure, with confirming volume, sitting in a discount zone — that's an institutional fingerprint worth respecting.
We covered the full Order Blocks with Market Structure indicator in our 2023 walkthrough — Market Character, Continuation Breakouts, CHoCH Fake-outs, the basics of how to read the tool. Today we're going deeper on Order Blocks specifically: what they really represent, how to separate signal from noise, and how the v2.5 Volumetric Order Block calculation gives you something that wasn't possible two years ago — a way to see whether buyers or sellers actually controlled the move that created the block.
What Order Blocks really are
In Smart Money Concepts (SMC) and ICT methodology, an Order Block is the last bearish candle before a bullish break of structure, or the last bullish candle before a bearish break of structure. That much is the textbook.
What that definition leaves out is why it matters. When institutions need to fill large orders, they can't simply hit the market — they'd move price against themselves. So they accumulate or distribute in layers, often at zones where price will return. The candle just before a clean structural break is frequently where the last batch of opposing orders was absorbed, where smart money's positioning became visible only after the breakout confirmed it. The zone they defended on the way up (or down) becomes the zone they're motivated to defend again if price revisits it. That's why Order Blocks work as future support and resistance — not because of pattern superstition, but because the people who took positions there have a vested interest in protecting them.
Without access to Level 2 data, no indicator can know with certainty which candles contain institutional orders. What the Order Blocks with Market Structure indicator does is apply the most reliable price-action proxies — significant candle before a break of structure, sized appropriately relative to recent range, validated against the broader swing structure — to surface the zones most likely to qualify. That's why the Market Structure component is in the name. Without it, you're drawing boxes. With it, you're tracking institutional positioning.
The Market Structure context that separates signal from noise
Order Blocks generated in isolation are worth almost nothing. Order Blocks generated by the same indicator that detects Break of Structure (BOS) and Change of Character (CHoCH) on two simultaneous swing timeframes — that's a different conversation.
The indicator runs two swing calculations in parallel:
- Fast Swing (default 5 bars) — short-term structure, used for intraday setups and faster Order Blocks
- Slow Swing (default 50 bars) — higher-timeframe structure, used to confirm or reject the fast-swing signals
When a bullish Order Block forms below a Fast Swing CHoCH that's also sitting below a Slow Swing higher low, the structural alignment is doing heavy lifting for you. Compare that to an Order Block that prints after a CHoCH on the Fast Swing alone, with the Slow Swing structure still bearish overhead — that's a counter-trend setup with limited room to run, and the Slow Swing labels (rendered with borders, while Fast Swing labels are borderless) tell you so immediately.
This is also why Breaker Blocks — Order Blocks that failed and flipped roles — and the ICT Unicorn pattern (Breaker Block plus overlapping FVG, covered in our June 2 post) work the way they do. They're built on the same structural logic, just one step further along the price journey.
What v2.5 changed: Volumetric Order Blocks
Until version 2.5, the volume analysis on each Order Block was an Anchored Volume Profile — it summed up buying and selling volume from the candle that formed the block forward, giving you a sense of the order flow inside the zone itself. Useful, but it told you what happened after the block formed, not what created it.
The new Volumetric Order Block calculation looks at the entire Market Structure Block — the candles from the one that created the swing level all the way to the one that broke it (the CHoCH or BOS candle). It then measures the bull volume and bear volume that accumulated during that price manipulation, and displays the total alongside a percentage that ranks this block against the other Order Blocks currently on your chart.
This is where Order Block trading gets genuinely interesting, because the volume breakdown lets you separate exhaustion from confirmation:
- Bullish OB with bull volume > bear volume: textbook accumulation. Buyers absorbed selling, then took control. Strong bullish bias on retest.
- Bearish OB with bear volume > bull volume: textbook distribution. Sellers absorbed buying, then took control. Strong bearish bias on retest.
- Bullish OB with bear volume > bull volume: seller exhaustion. Sellers were active but lost control. A bullish reversal may follow as buyers take over.
- Bearish OB with bull volume > bear volume: buyer exhaustion. Buyers were present but failed to sustain control. Price may drop, making this a valid bearish continuation zone.
- Volume delta near zero: indecision. The block is weaker and less likely to hold. Skip it or wait for additional confirmation.
The percentage metric is the part most traders miss. When you have five Order Blocks visible on the chart and three of them are at 5–10% each but one is at 38%, you're not looking at five equally valid zones. You're looking at one zone where most of the structural volume was concentrated, and four that exist as backups. Trade the 38% block. Note the others for invalidation, not for entry.
How to actually trade Order Blocks
There are three setups the indicator surfaces cleanly:
1. The Order Block Bounce
This is the bread-and-butter setup, and it's exactly what the 2023 post described — but with the volumetric data, you can finally pre-qualify the block before price arrives. When a new Order Block prints, don't enter immediately. Wait for price to revisit the zone. On the retest, check the volume breakdown: if the original block had strong directional volume that aligns with your trade thesis, take it. If it's mixed or contradictory, pass.
Combined with Protected Pivots — the highs and lows that get safeguarded after a structural break — you have a built-in invalidation level. Many traders use the most recent Protected Low as a stop-and-reverse point when going long off a bullish Order Block, and the Protected High for shorts.
2. Order Block + Discount/Premium Zone confluence
Premium and Discount zones are calculated from the highs and lows of the Slow Swing range — Premium is the top 5%, Discount is the bottom 5%, Equilibrium sits around the midpoint. A bullish Order Block in the Discount zone is a higher-probability setup than the same Order Block in the Premium zone, for the same reason Wyckoff accumulation zones tend to form in low ranges and distribution zones in high ranges. Smart money buys cheap and sells expensive.
This pairs naturally with reversal-context tools like Buyside & Sellside Liquidity for spotting where stops are clustered, and with momentum confirmation from Effort vs Results when you want to confirm that the buying pressure at a Discount-zone Order Block actually has weight behind it.
3. The Anchored VWAP confluence
The indicator's hidden plots include four Anchored VWAPs — anchored to the last Higher High and Lower Low on both Fast and Slow swings. When price revisits an Order Block and the relevant Anchored VWAP sits at the same level, you've got two independent calculations pointing at the same zone. This is a confluence setup that works best as a filter, not a primary signal: use it to upgrade existing Order Block setups, not to invent new ones.
Common mistakes that wreck Order Block trading
Treating every Order Block as equal. The volumetric percentage exists specifically to rank them. Use it. A 5% block in the wrong structural context is a coin flip.
Trading Fast Swing Order Blocks against Slow Swing structure. The indicator gives you both for a reason. If the Slow Swing is bearish and you're taking a bullish Fast Swing Order Block, you're scalping against the higher-timeframe tide. Some traders do this successfully, but they treat it as a scalp, not a swing.
Ignoring the Filter setting. The OB Filter (Cumulative Mean Range or ATR) is designed to suppress order blocks that are too small to matter — anything where the candle range is less than double the filter value gets excluded from consideration. If you're seeing too much noise, the filter is your knob. If you're seeing too few blocks, loosen it.
Forgetting that fulfilled Order Blocks have a second life. When a bullish OB gets violated to the downside, it doesn't disappear from relevance — it becomes a candidate Breaker Block. That's the bridge into our next post on Breaker Blocks, which builds directly on what we covered here.
The bigger picture
Order Blocks are not a magic system. No indicator is. What they are is a clean, repeatable framework for identifying where significant trading interest entered the market, validated against the broader structural context, and ranked by the volume that created them. Used correctly — with Market Structure context, with the volumetric ranking, with structural invalidation via Protected Pivots — they give you a high-conviction entry framework that you can backtest, optimize, and trust.
The Order Blocks with Market Structure indicator is one of our most popular tools because it does the heavy lifting of identifying these zones in real time, on any instrument and any timeframe, across two independent swing calculations. If you're trading Smart Money Concepts on NinjaTrader 8, it's the foundational piece that the rest of the toolkit builds on.
Related Indicators
If you found this useful, these indicators extend the Order Block framework:
- Breaker Blocks — Order Blocks that failed and flipped roles (covered in next week's post)
- ICT Unicorn — Breaker Block + overlapping FVG, one of the highest-conviction ICT patterns
- Buyside & Sellside Liquidity — finds where stops are clustered above and below Order Blocks
- Effort vs Results — confirms whether volume actually supported the move that created the block
Disclaimer: Trading futures and other leveraged instruments involves substantial risk of loss and is not suitable for all investors. Past performance and indicator signals are not indicative of future results.