ScalperIntel
Historical Volatility Percentile
Historical Volatility Percentile
Couldn't load pickup availability
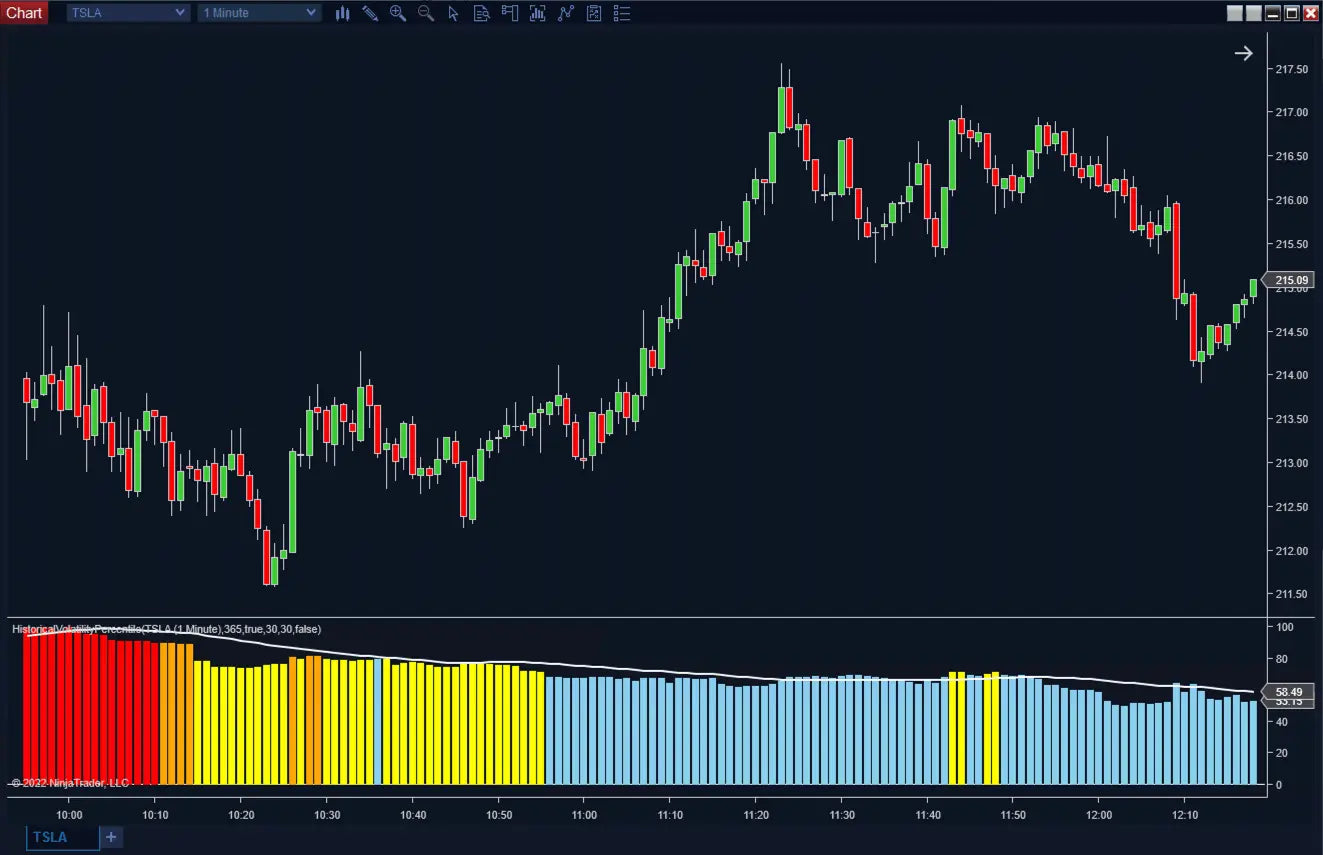
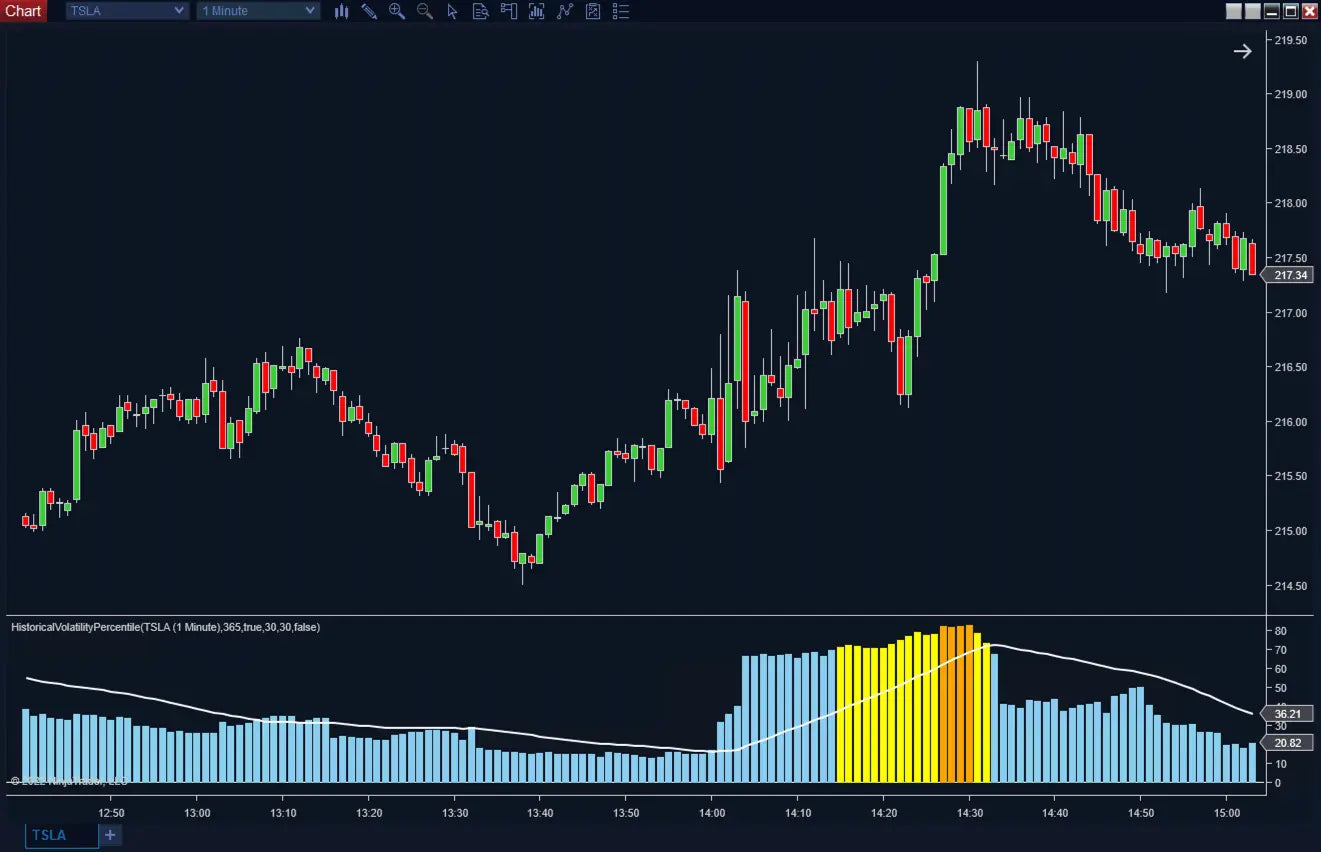
The Historical Volatility Percentile (HVP) is a statistical-based indicator that evaluates the deviation from the average price of an instrument in a given time period. It is usually used to measure the likelihood that a security's price will move away from its current value. This indicator is best used as a confluence or to filter trade signals.
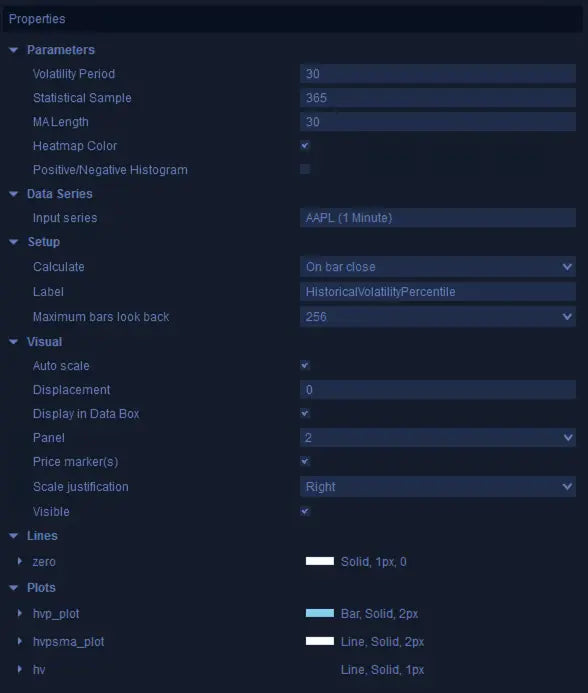
Several customization options are available for this indicator, such as
- Volatility Period: the period during which the average volatility is calculated upon.
- Statistical Sample: the period in which the volatility is compared against
- MA period: the period in which SMA is plotted on the chart to create a baseline.
Other visual customization options are available such as
Heatmap color
- Red - More than 90%
- Orange - More than 80%
- Yellow - More than 70%
- Blue - For below 70%
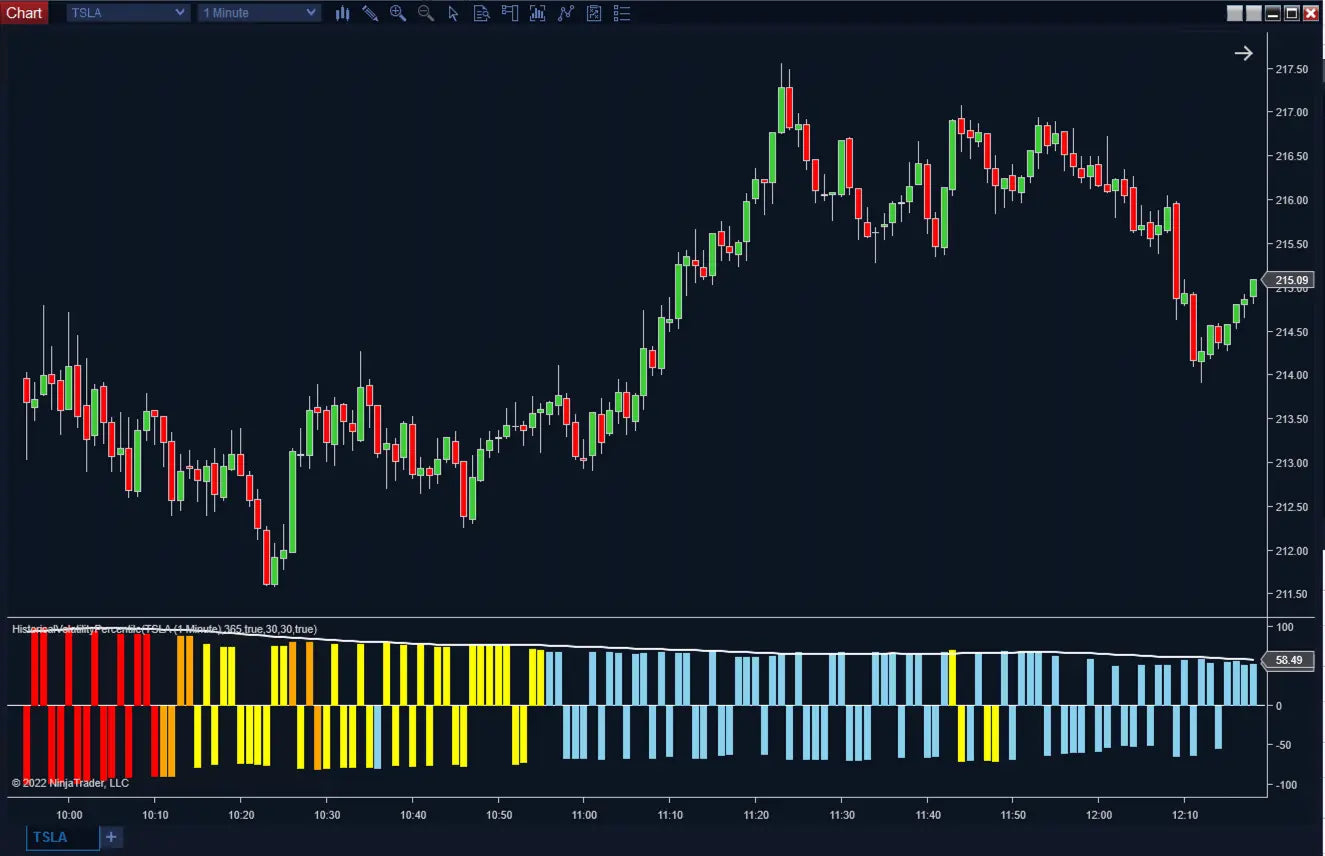
Positive/Negative Histogram
- Plots the HVP value below zero when the candle close is in decline and above zero when it's inclining
Features
Features
Recommended Timeframe
Recommended Timeframe
All Timeframes
Supported Systems
Supported Systems
NinjaTrader 8, SharkIndicators Bloodhound 1 or 2, and SharkIndicators Blackbird 1
Version
Version
1.0
First Release Date
First Release Date
-
License Terms
Prices shown are for a single license. Each license can be linked to one NinjaTrader User ID, allowing the indicator to run on up to two machines concurrently under the same User ID.
Version minor upgrades and bug fixes are included within the lifetime license. For more license details, review Terms of Service
-
Refund Terms
7-days 100% money back guarantee when trial licenses was not offered for the customer. For more details, review Refund Policy

