ScalperIntel
Liquidity Swings
Liquidity Swings
Couldn't load pickup availability
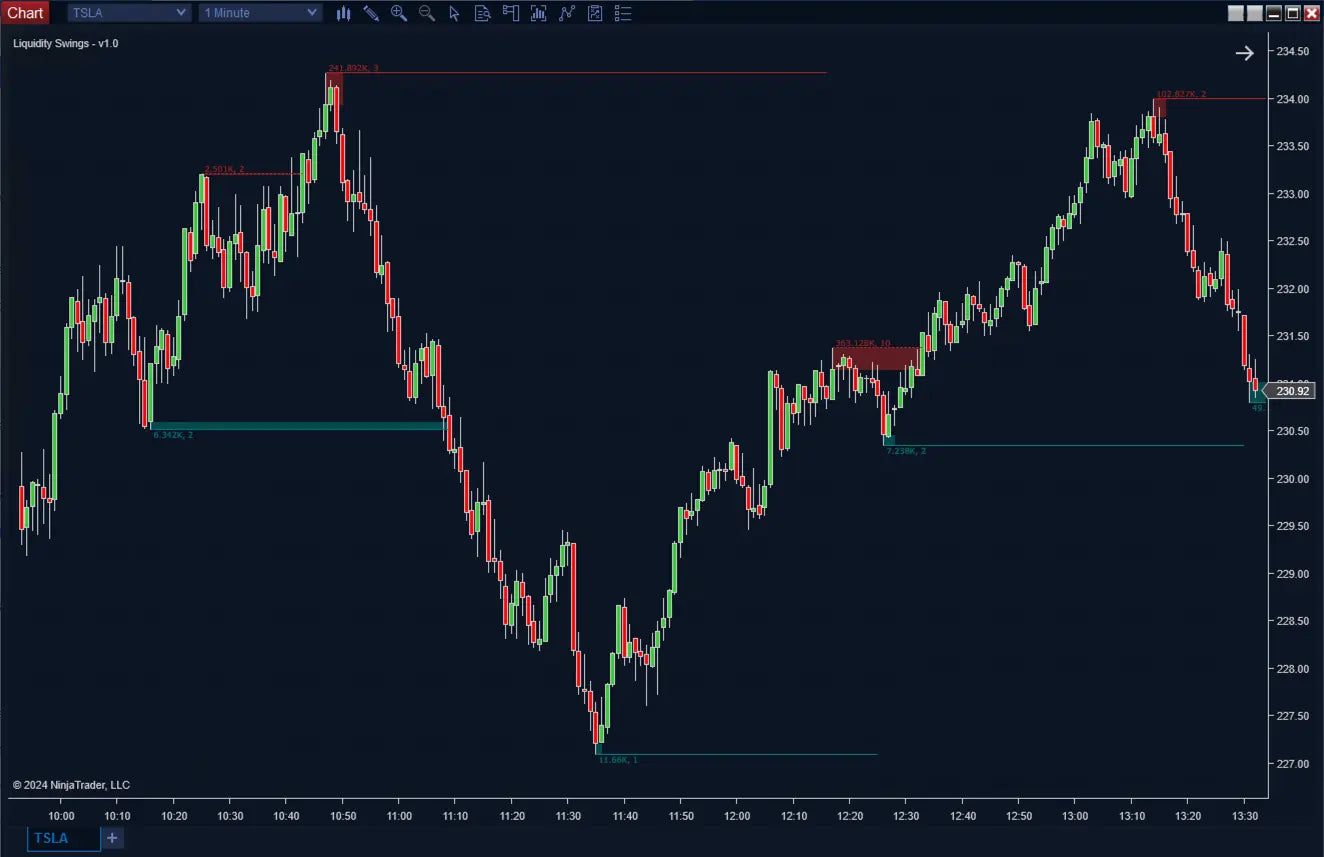
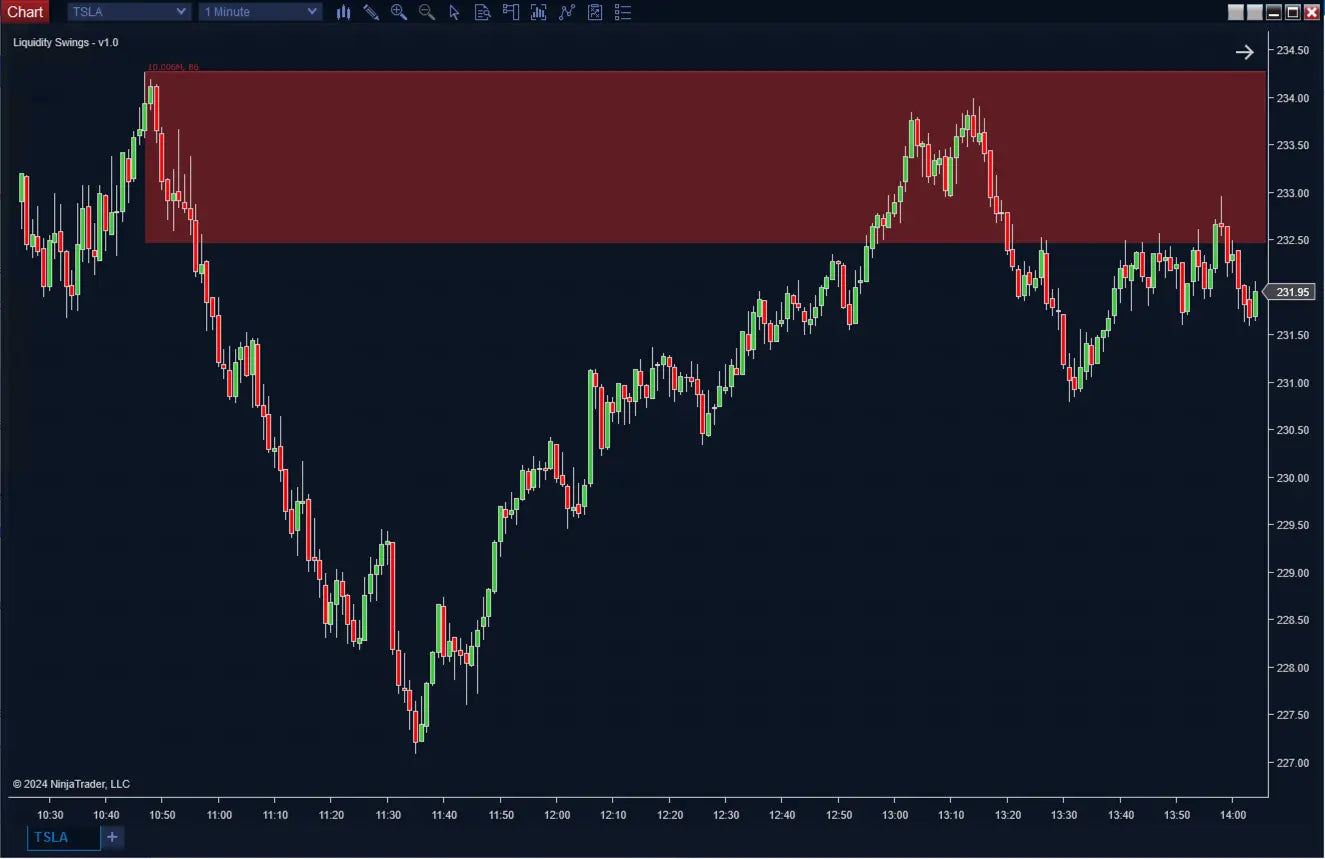
The Liquidity Swings Indicator is a powerful tool for traders, highlighting key swing areas from price action. By identifying significant swing highs and lows zones, and calculating the volume profile within these zones, this indicator offers deep insights into market dynamics. It leverages swing structures and can utilize higher timeframe data for enhanced accuracy. With the ability to filter swings by retests or minimum volume, traders can pinpoint high-probability trading opportunities. Whether you're looking to understand market sentiment or find crucial support and resistance levels, the Liquidity Swings Indicator is an indispensable asset.
Features
- Swing Area Highlighting: Identifies and marks swing highs and lows based on the specified lookback period.
- Volume Profile Calculation: Calculates and displays the volume within swing zones, providing insights into market participation.
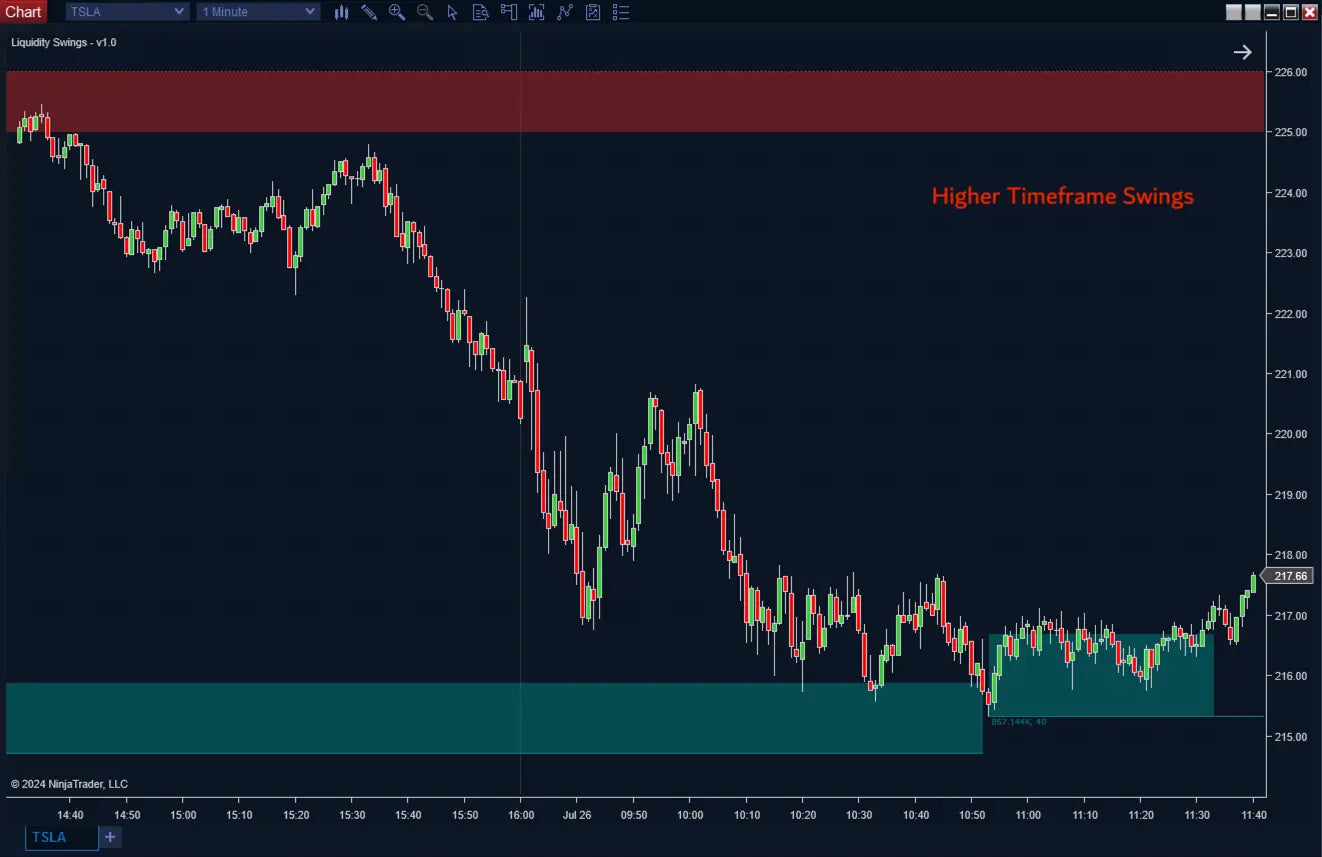
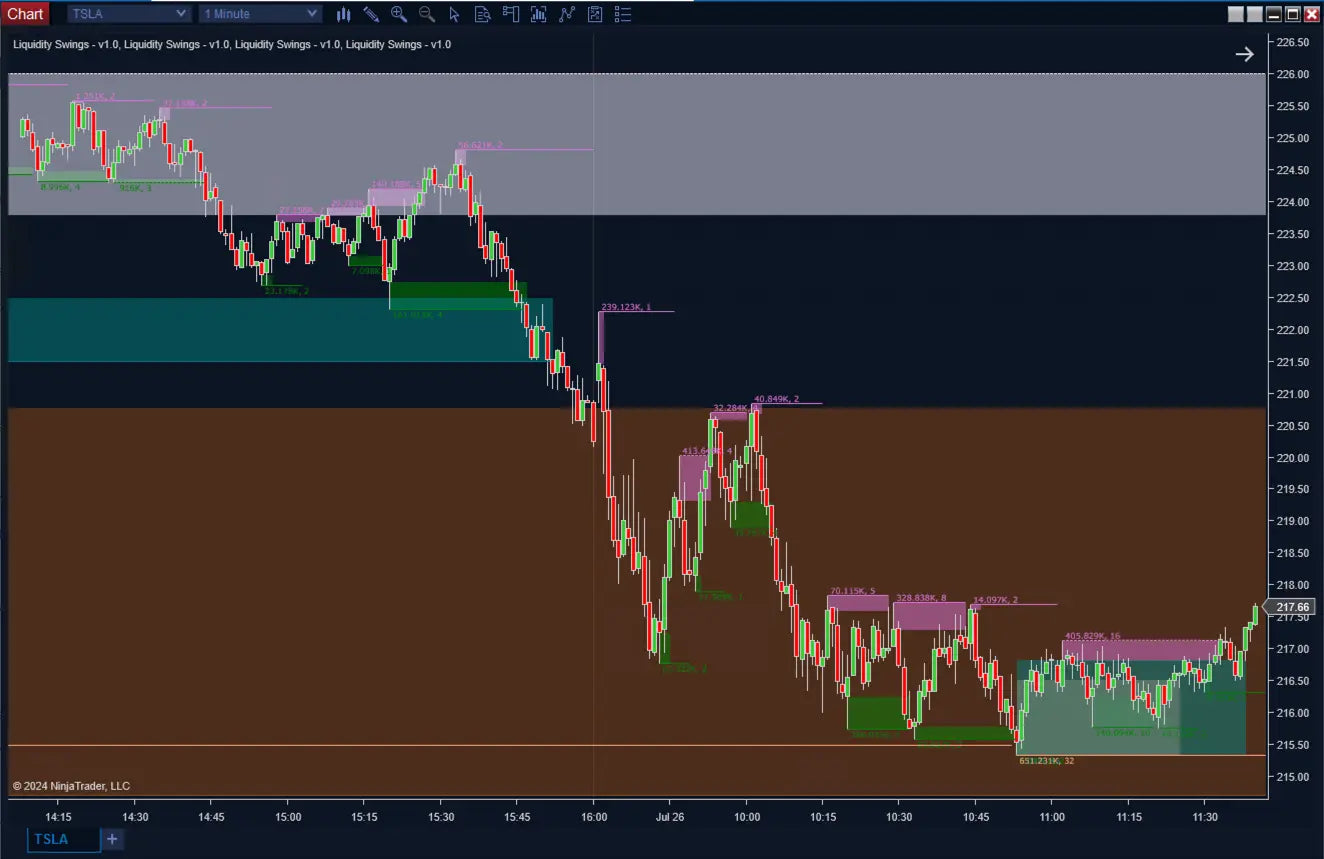
- Higher Timeframe Analysis: Supports higher timeframe data (e.g., 5 min, 10 min, 15 min, 30 min, 1 hour, 4 hours, 1 day, 1 week) for more accurate swing identification.
- Volume Display Options: Shows selling volume at swing highs and buying volume at swing lows, with options for total volume or delta (Buy minus Sell).
- Swing Level Visualization: Highlights swing levels and displays broken swing levels as dashed lines, indicating bullish or bearish sentiment.
- Filtering Capabilities: Filters swings by the number of retests or minimum volume, ensuring focus on significant market activity.
- Retrospective Display: Confirms swing points after the pivot lookback period, displaying all elements retrospectively for accurate analysis.
Enhance your trading strategy with the External Liquidity or Liquidity Swings Indicator. Identify key market levels, analyze volume profiles, and gain a deeper understanding of market dynamics. Start leveraging this powerful tool today and make more informed trading decisions.
Disclaimers
- Performance Considerations: The indicator performs complex calculations when higher timeframe data is used. This may impact the performance and speed of the chart.
- Higher Time Frame: supports only Time-Based Charts, but without Higher Timeframe settings, it supports any type of charts with Highs and Lows data.
Features
Features
Recommended Timeframe
Recommended Timeframe
Mulitimeframe
Supported Systems
Supported Systems
NinjaTrader 8, SharkIndicators Bloodhound 1 and 2, and SharkIndicators Blackbird 1
Version
Version
1.0
First Release Date
First Release Date
-
License Terms
Prices shown are for a single license. Each license can be linked to one NinjaTrader User ID, allowing the indicator to run on up to two machines concurrently under the same User ID.
Version minor upgrades and bug fixes are included within the lifetime license. For more license details, review Terms of Service
-
Refund Terms
7-days 100% money back guarantee when trial licenses was not offered for the customer. For more details, review Refund Policy

