ScalperIntel
ICT Bias
ICT Bias
Couldn't load pickup availability
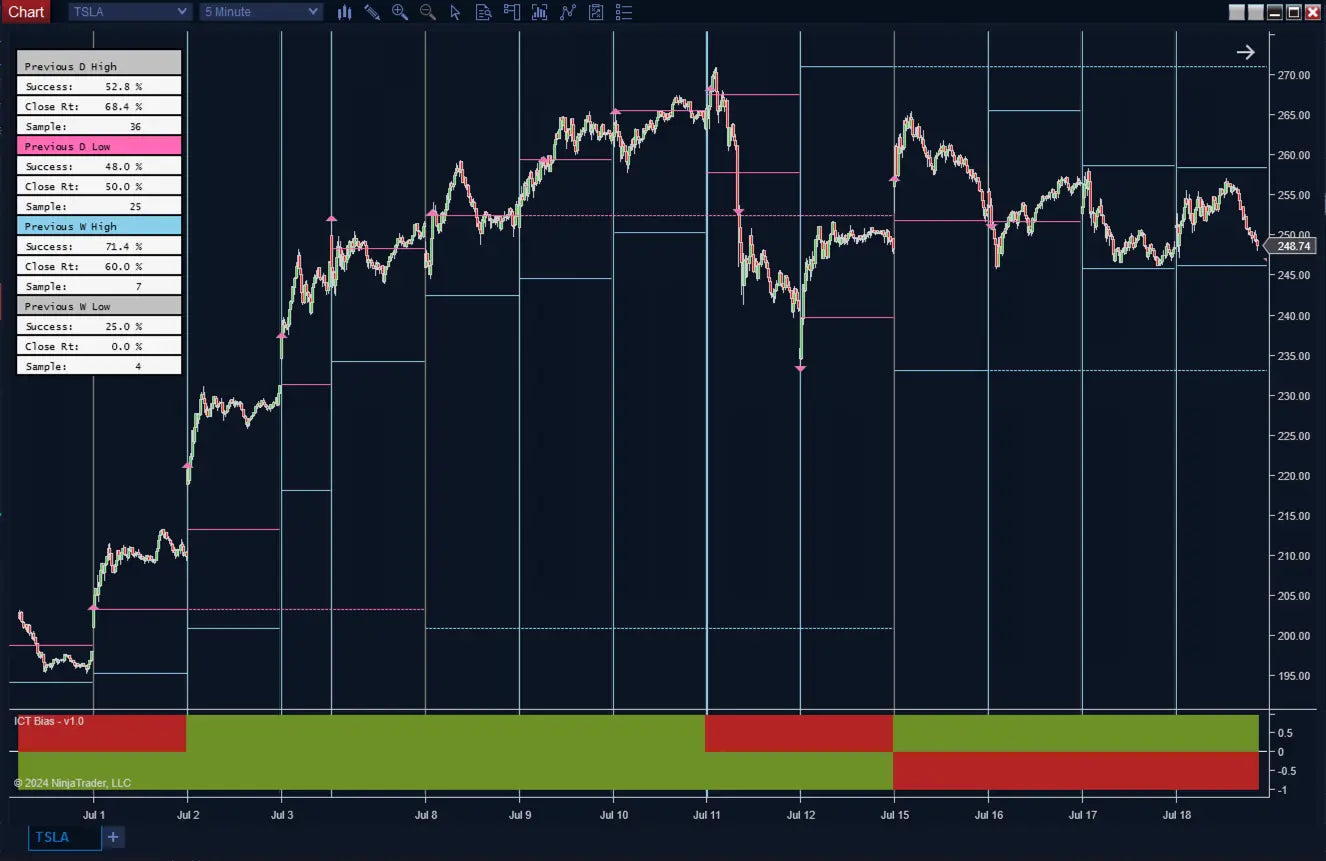
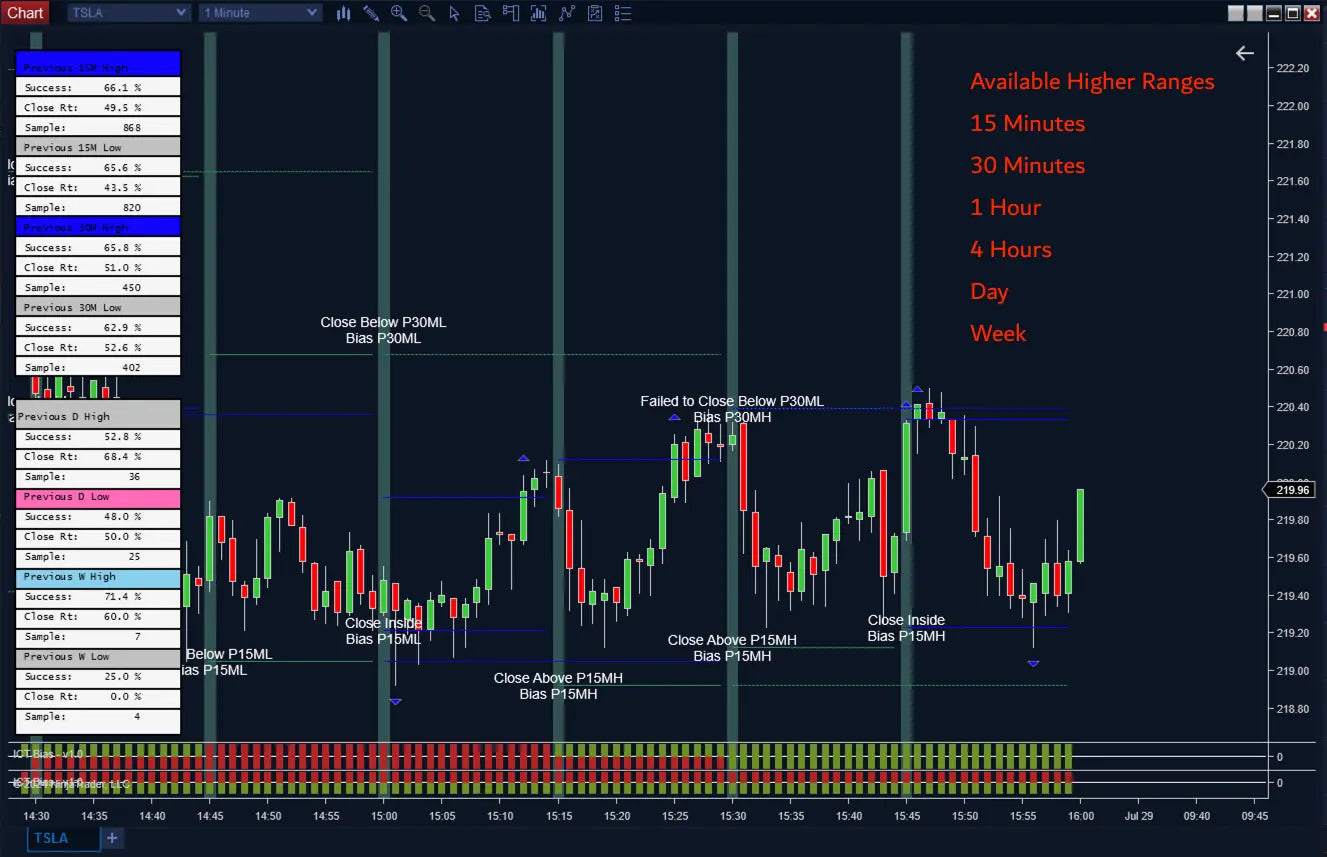
The ICT Bias Indicator, is a versatile tool designed to help traders identify market bias levels across various timeframes, including daily and weekly defaults, as well as customizable intraday timeframes such as 15 minutes, 30 minutes, one hour, and four hours. By analyzing historical high and low levels, this indicator provides key insights into potential market movements and augments any trading strategy used on a lower timeframe.
The Concept
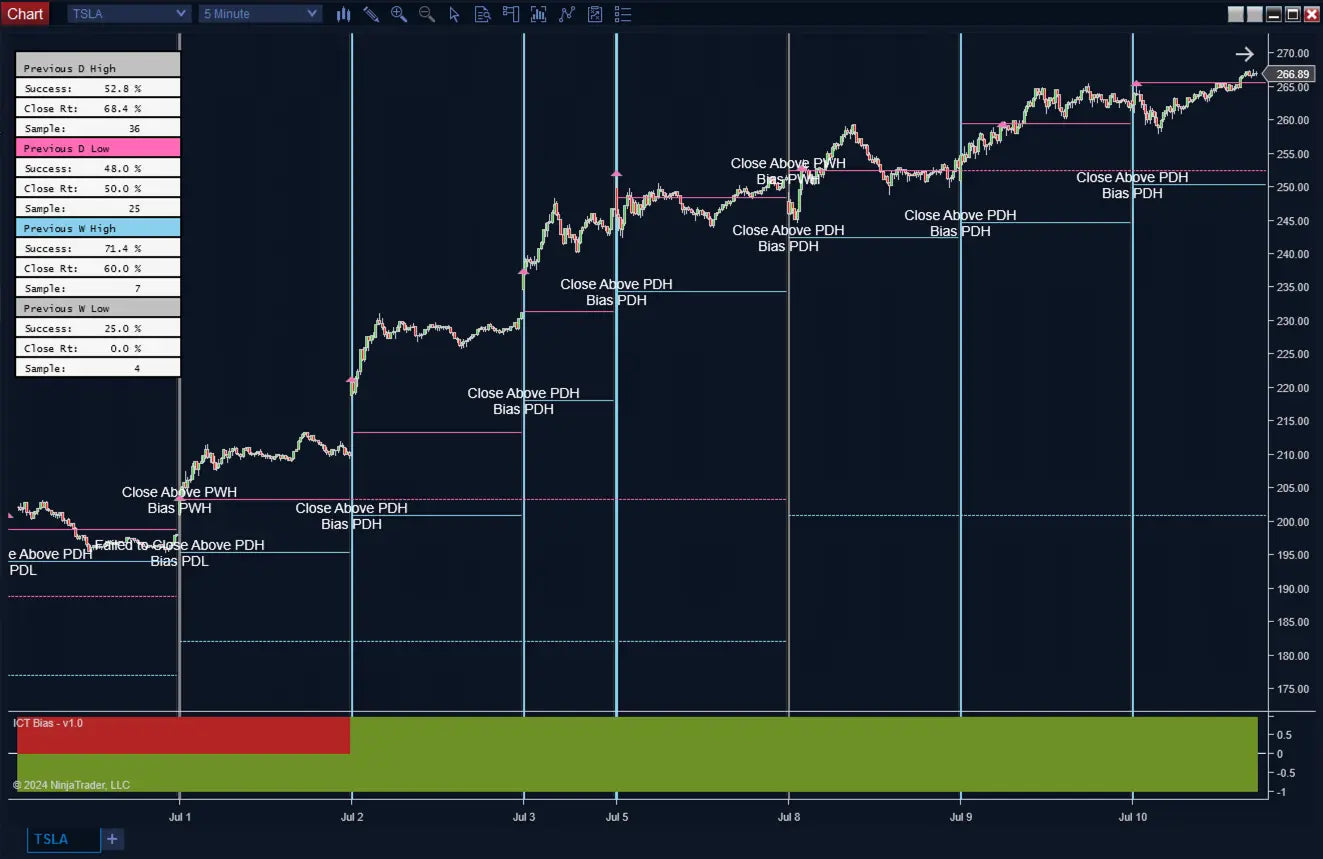
The ICT Bias concept is a powerful tool for forecasting the likely direction of the market. It focuses on identifying anticipated price movements—whether bullish, bearish, or neutral—by analyzing previous price levels and market behaviors. The concept can be summarized as follows:
- If the price closes above the previous higher period high, the following period's bias targets the previous period high (e.g., previous day high).
- If the price trades above the previous higher period high but closes below it, the bias targets the previous period low (e.g., previous day low).
- If the price closes below the previous period low, the bias targets the previous period low.
- If the price trades below the previous period low but closes above it, the bias targets the previous period high.
- If the price trades as an inside bar, it refers to the previous candle for bias. If the previous period closed above its open, it targets the previous period high, and vice versa.
- If the price trades as an outside bar taking both the previous period high and low but closes inside the range, no bias is assigned.
Key Features
- Customizable Timeframes: Default settings for daily and weekly, with options for intraday timeframes such as 15 minutes, 30 minutes, one hour, and four hours.
- Bias Calculation: Calculation of bias levels based on previous high and low levels.
- Visual Indicators: Display of bias labels and high/low levels with customizable colors.
- Performance Statistics: Highlighting bias success and failure rates with detailed statistical information.
- Alerts: Optional alerts for key events, ensuring traders never miss critical market movements.
- Previous High/Low: Uses the previous period’s high and low levels for potential reversals or continuations.
- Hidden Plots: All data shown on the screen is also provided as hidden plots, enabling you to automate your trading strategy seamlessly.
Unlock the power of market bias analysis with the ICT Bias Indicator. Customize your trading strategy with flexible timeframe options and gain valuable insights into market movements. Whether you're a day trader or prefer longer timeframes, the ICT Bias Indicator is your go-to tool for accurate market forecasting.
Disclaimers
- Time-Based Charts Only: This indicator can only be used on time-based charts.
- Performance Considerations: The ICT Bias Indicator uses two additional higher timeframes data series in its calculations. As a result, it may feel heavy or slow. This is a reasonable trade-off for the depth of analysis it provides.
Features
Features
Recommended Timeframe
Recommended Timeframe
Intraday and Time Based Charts
Supported Systems
Supported Systems
NinjaTrader 8, SharkIndicators Bloodhound 1 or 2, and SharkIndicators Blackbird 1
Version
Version
1.0
First Release Date
First Release Date


-
License Terms
Prices shown are for a single license. Each license can be linked to one NinjaTrader User ID, allowing the indicator to run on up to two machines concurrently under the same User ID.
Version minor upgrades and bug fixes are included within the lifetime license. For more license details, review Terms of Service
-
Refund Terms
7-days 100% money back guarantee when trial licenses was not offered for the customer. For more details, review Refund Policy


