


ScalperIntel
Equal Highs and Lows
Equal Highs and Lows
Up to 2
machines per license
- Instant download after checkout
- Lifetime updates included
- NinjaTrader 8 compatible
- Direct support from the team
Enter it to unlock an offer.
Your offer is on its way.
We've emailed your offer. Check your inbox (and spam) for the link to get started.
Couldn't load pickup availability
Overview
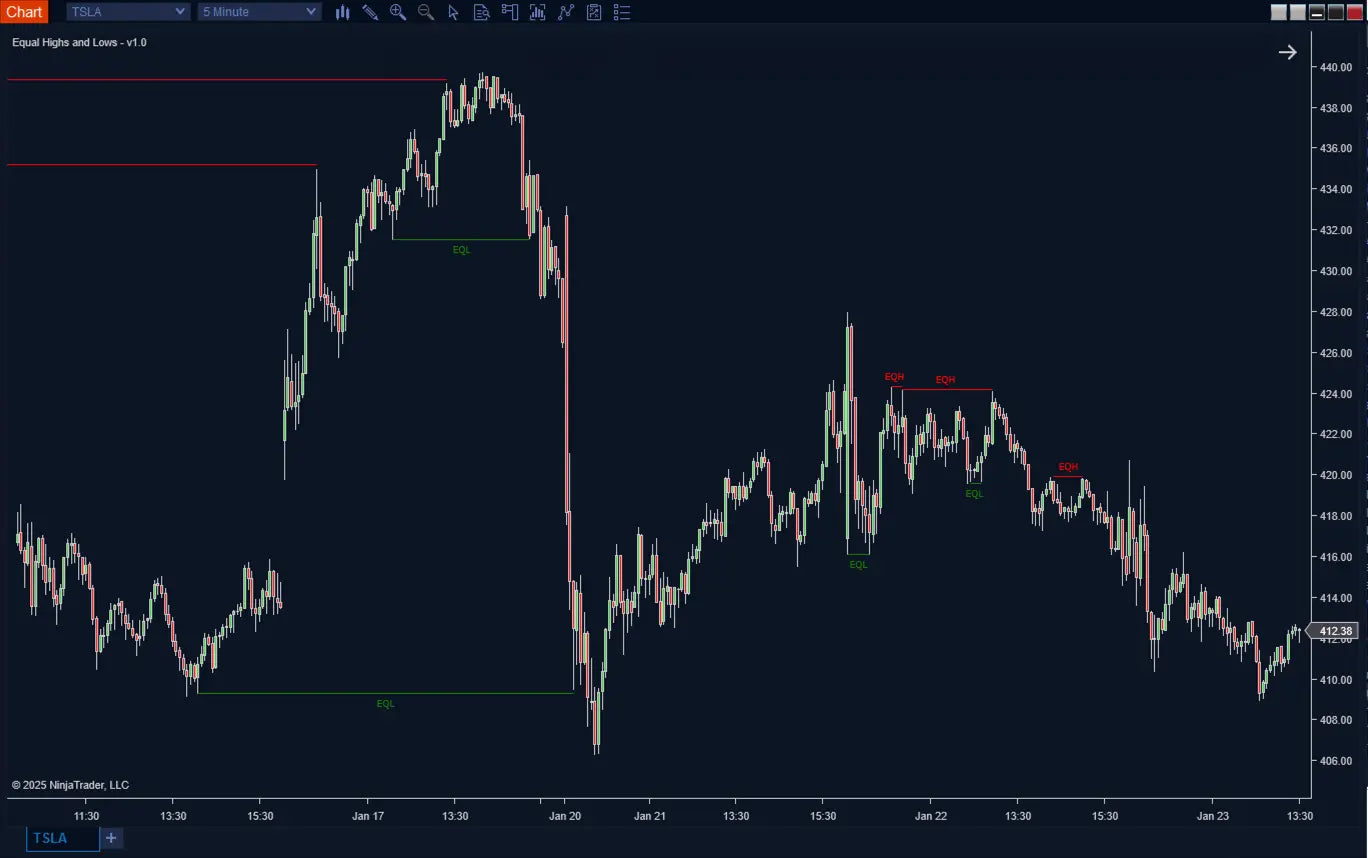
Equal Highs and Lows (EQH/EQL) for NinjaTrader 8 — automatically detects liquidity zones where price forms equal highs (EQH) and equal lows (EQL), marking the exact areas where stop orders cluster and the market is most likely to react.
Built for ICT and Smart Money traders. Non-repainting after confirmed pivots, automation-ready, Strategy Builder compatible.
What Makes It Different
Trading Concepts You'll Use
- ICT liquidity concepts
- Stop-loss clusters
- Liquidity sweeps & stop hunts
- Pivot-based market structure
- Breakout & reversal triggers
- Smart Money Concepts
Features
Core Detection
- Automatic EQH & EQL Detection: Identifies equal highs and lows based on swing structure — no manual chart marking.
- Pivot-Based Confirmation: Waits for confirmed pivot structures to filter out weak or insignificant levels.
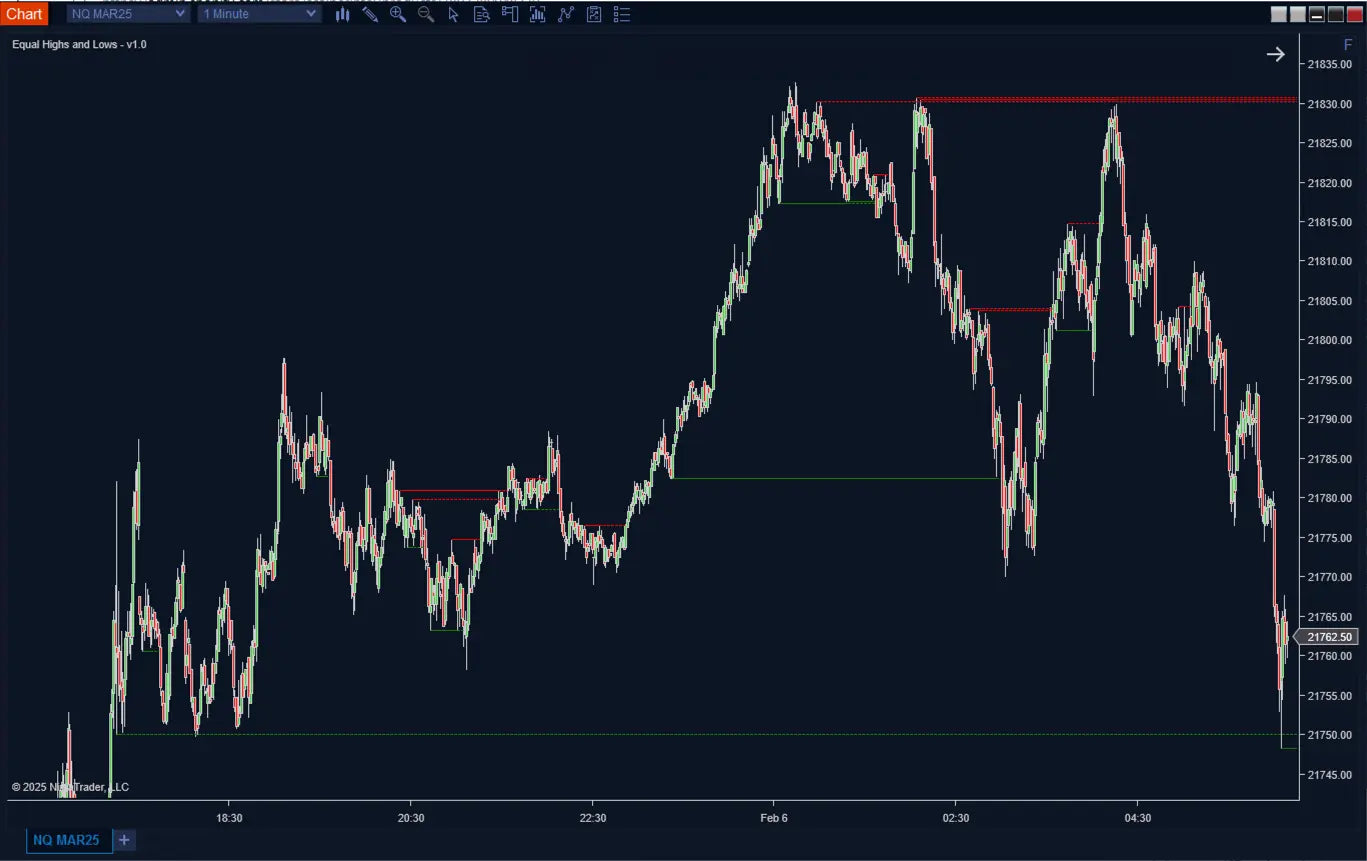
- Adjustable Sensitivity: Configure pivot lookback (significance) and threshold (closeness) for any style.
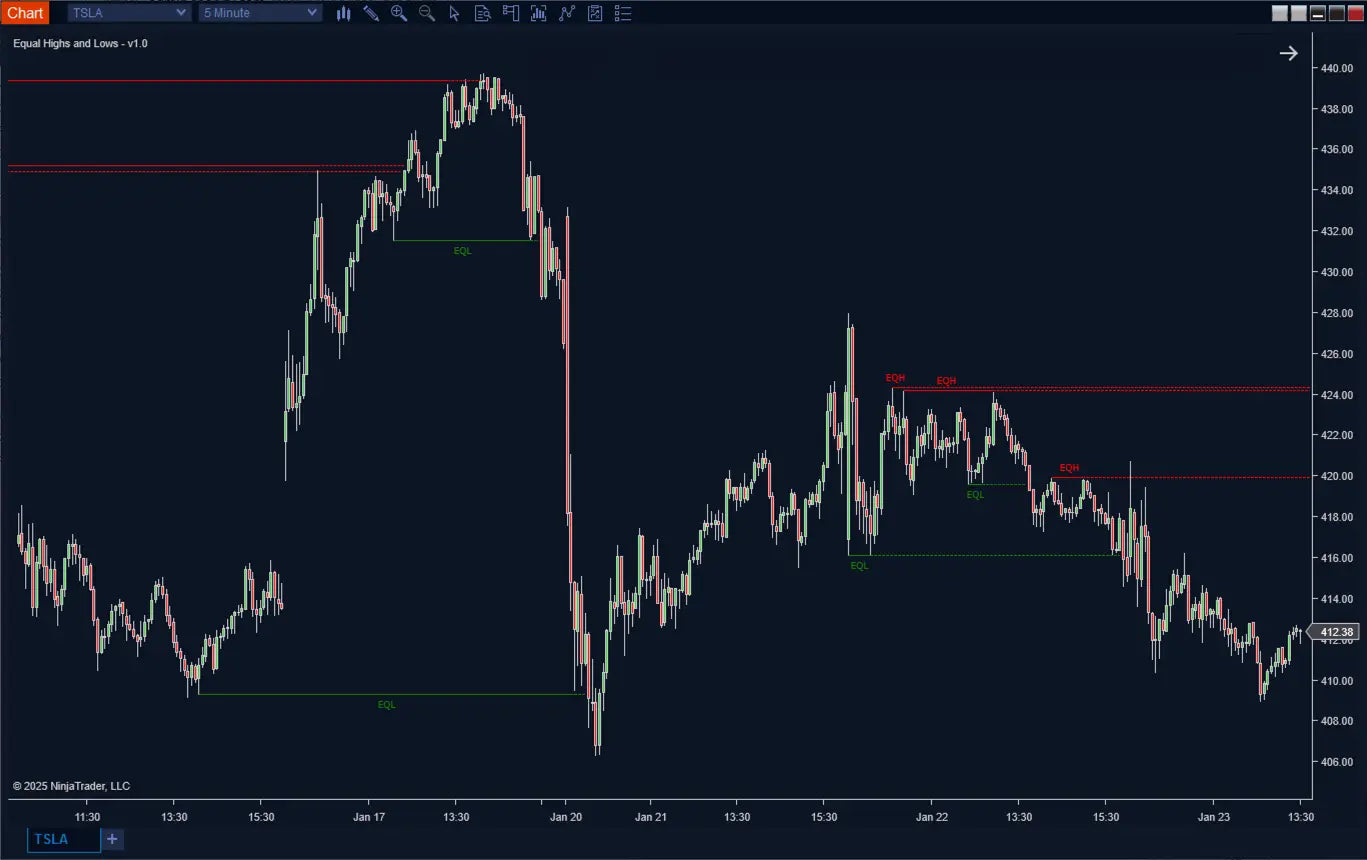
- Persistent Levels: Lines remain on chart even after being broken so you can track historical sweeps.
- Extendable Lines: Project levels forward for ongoing market reference.
- Optional Labels: Quick identification of each level with toggleable labels and positioning.
Automation & Pro Tools
- Signal Plot: -1 = EQH detected, +1 = EQL detected — direct automation trigger.
- LastEQH / LastEQL Plots: Price values of the most recent equal high and low for Strategy Builder logic.
- Active Level Tracking: Hidden plots track which levels are currently in play.
- Customizable Visualization: Colors, line width, style, label position all adjustable.
- Confluence-Friendly: Pairs with FVG, Order Blocks, SMT, and CISD for stacked liquidity setups.
How It Compares
How this stacks up against basic support/resistance tools on the market.
| Feature | ScalperIntel | Basic S/R Tools |
|---|---|---|
| Detection Method | ✔ Pivot-based | ✖ Manual / arbitrary |
| Liquidity Focus | ✔ Yes | ✖ Limited |
| Automation | ✔ Strategy Builder | ✖ No |
| Repainting | ✔ Non-repainting | ✖ Varies |
| Noise Filtering | ✔ Structured | ✖ Weak |
| Historical Tracking | ✔ Persistent levels | ⚠ Limited |
Compatibility
Platform Support
- NinjaTrader 8 — Latest stable build. Works across all NT8-supported instruments.
- Strategy Builder — Signal, LastEQH, and LastEQL exposed for full automation.
- BloodHound — Combine EQH/EQL with BloodHound logic packs.
- Blackbird — Strategy chains supported.
Reliability & Trust
- ✔ Levels appear only after pivot structure is validated — no repainting after confirmation
- ✔ Hidden signals update earlier for automation use
- ✔ Reliable for live trading and Strategy Builder backtesting
- ✔ Continuously updated — bug fixes and new features included with every Lifetime License
FAQ
How is this different from regular support/resistance?
EQH/EQL specifically targets liquidity — areas where retail stops cluster. It uses pivot confirmation to filter noise, so you get cleaner liquidity zones rather than generic horizontal lines.
Does it repaint?
No. Levels appear only after pivot structure is confirmed, with no repainting after that. Hidden plots update slightly earlier for automation use.
How should I tune sensitivity?
Use tighter threshold and shorter pivot lookback for scalping. Use wider threshold and longer lookback for swing trading. This lets the same indicator adapt to any style.
Can I automate this?
Yes. The signal plot (-1 EQH, +1 EQL), LastEQH/LastEQL price values, and active level tracking are all exposed for Strategy Builder.
What pairs well with EQH/EQL?
FVG, Order Blocks, SMT Divergences, and CISD — EQH/EQL gives you the liquidity zone; the other tools give you the entry trigger.
Will I get future updates?
Yes — every Lifetime License includes all minor updates and bug fixes for as long as the product exists. Major version upgrades are also included.
-
License Terms
Prices shown are for a single license. Each license can be linked to one NinjaTrader User ID, allowing the indicator to run on up to two machines concurrently under the same User ID.
Version minor upgrades and bug fixes are included within the lifetime license. For more license details, review Terms of Service
-
Refund Terms
7-days 100% money back guarantee when trial licenses was not offered for the customer. For more details, review Refund Policy
