


ScalperIntel
Historical Volatility Percentile
Historical Volatility Percentile
Up to 2
machines per license
- Instant download after checkout
- Lifetime updates included
- NinjaTrader 8 compatible
- Direct support from the team
Couldn't load pickup availability
Overview
Historical Volatility Percentile (HVP) for NinjaTrader 8 — ranks current volatility against historical behavior using a percentile-based statistical model, so you instantly know whether the market is quiet, active, or entering an expansion phase.
Built for traders who use volatility as a strategy filter. Non-repainting, automation-ready, Strategy Builder compatible.
What Makes It Different
Trading Concepts You'll Use
- Volatility regime analysis
- Historical volatility (HV)
- Statistical percentile ranking
- Contraction & expansion cycles
- Breakout filtering
- Mean reversion vs trend conditions
Features
Core Detection
- Percentile Ranking: Ranks current historical volatility against a defined statistical sample.
- Regime Identification: Identifies quiet, active, and highly volatile market conditions.
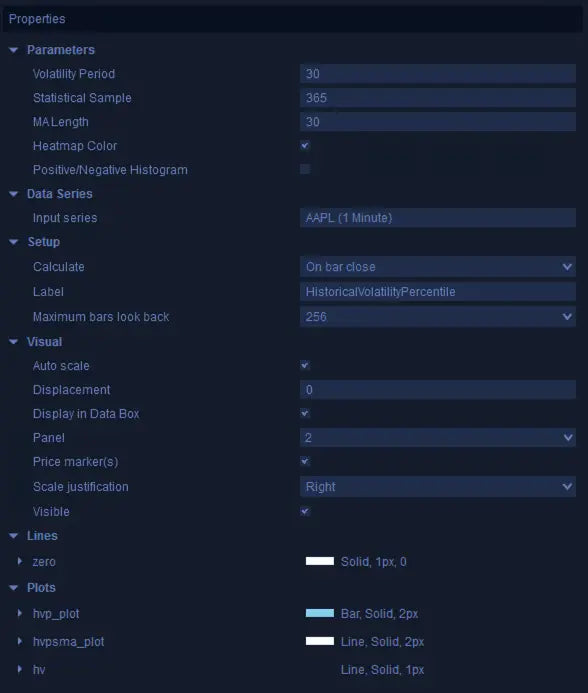
- Configurable Volatility Period: Define the lookback for the current volatility calculation.
- Configurable Statistical Sample: Define the historical comparison window.
- Moving Average Baseline: Plots an MA over HVP for smoother volatility analysis.
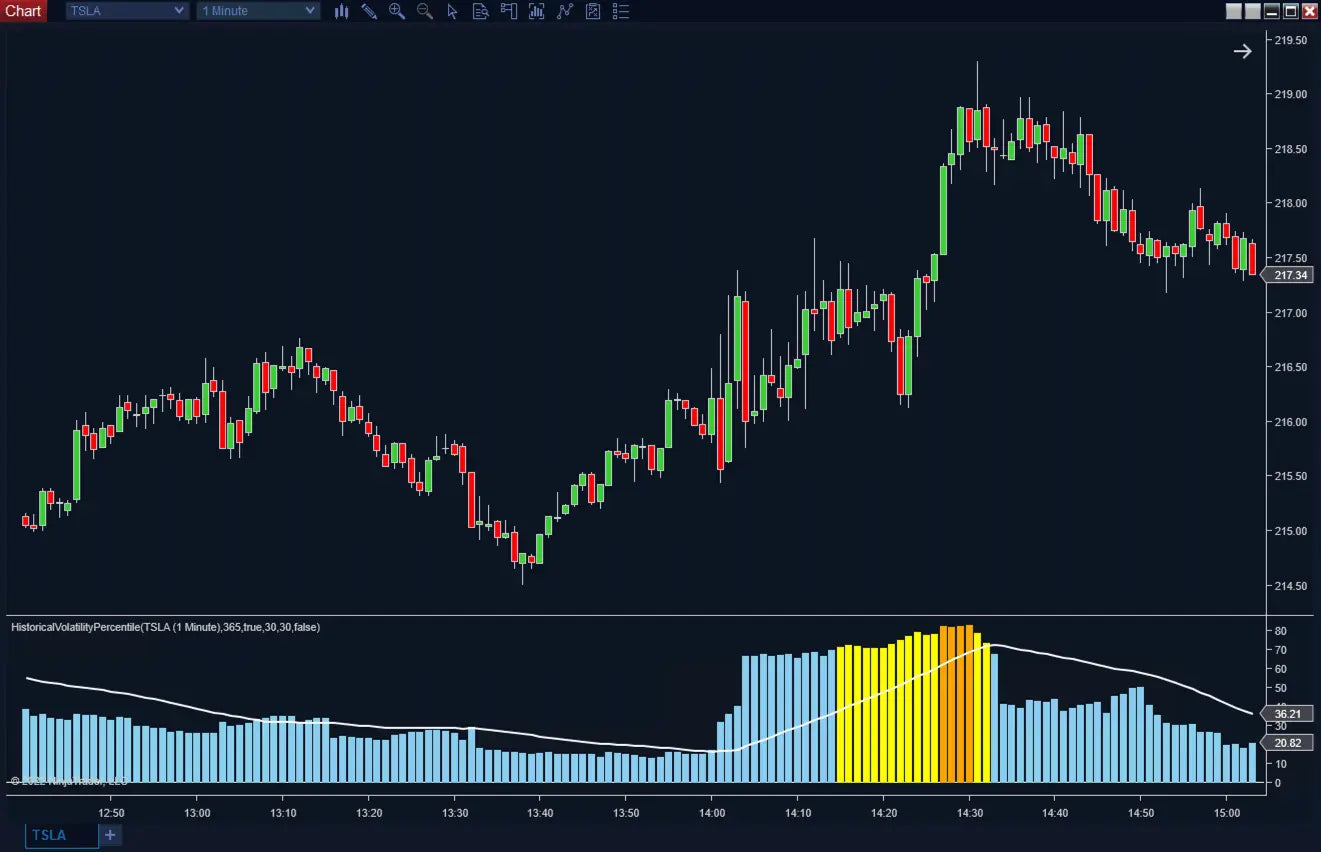
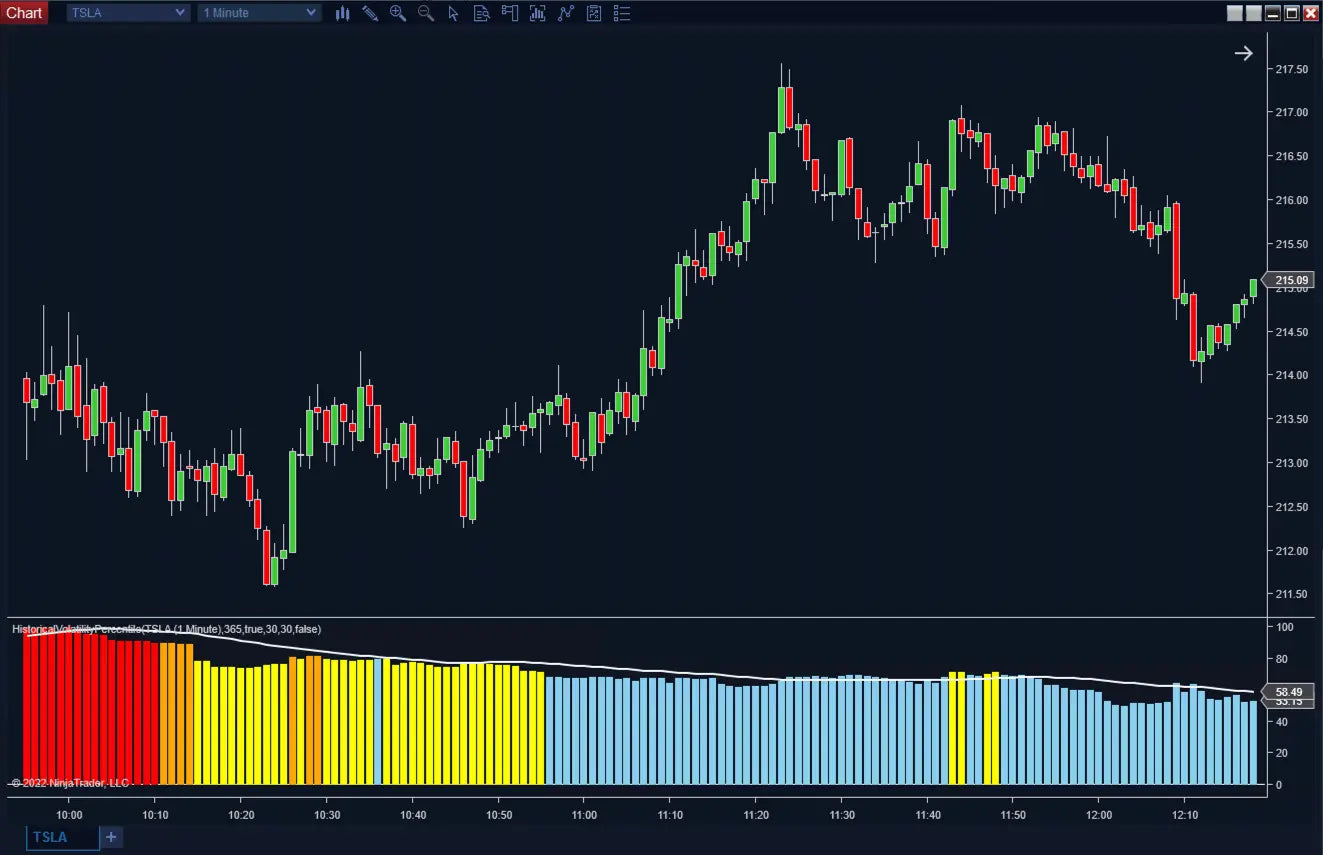
- Heatmap Coloring: Optional zone highlighting — red, orange, yellow, blue bands.
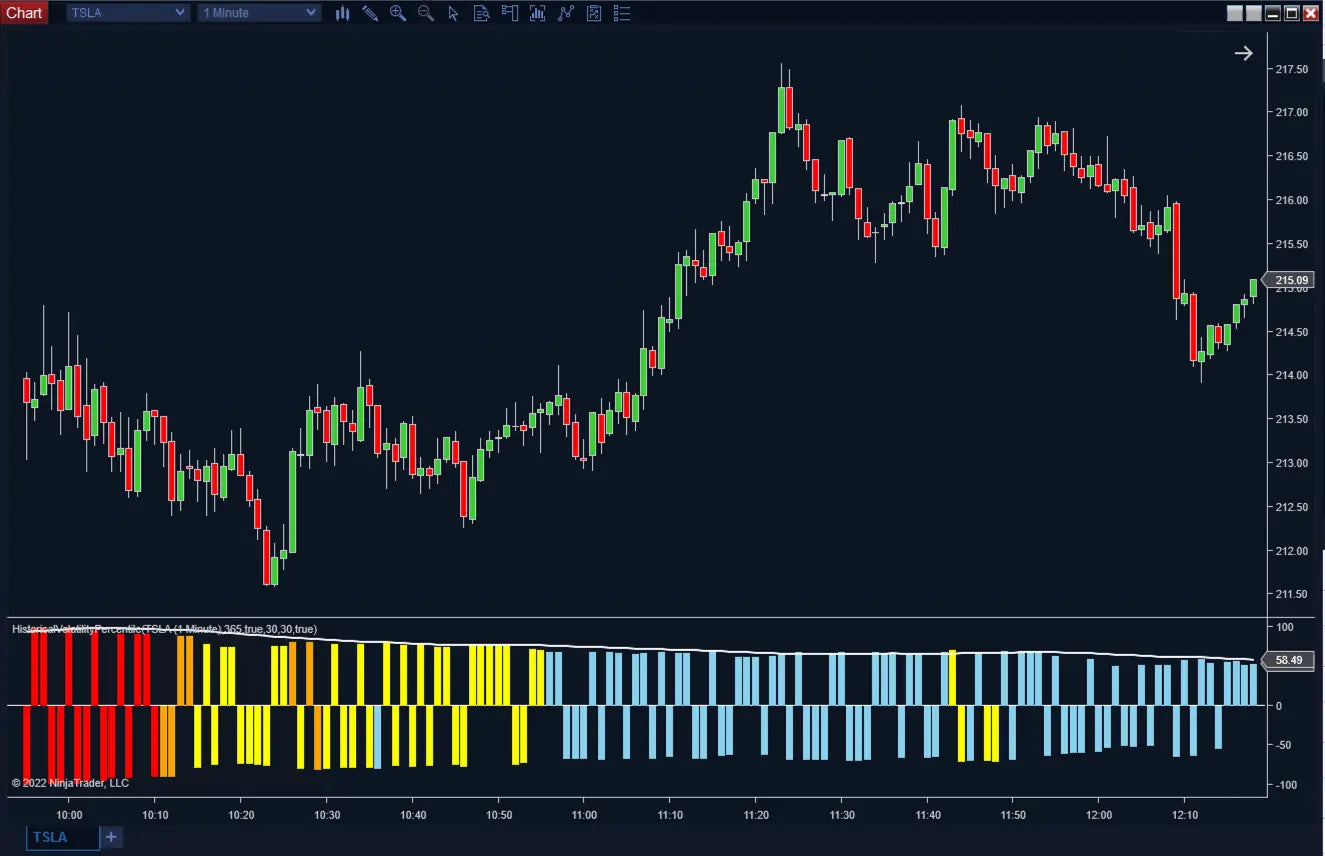
- Histogram Visualization: Clear visual interpretation, plus optional directional histogram.
Automation & Pro Tools
- Hidden Plots: HVP value, HVP MA, and historical volatility all exposed for Strategy Builder.
- Market Analyzer Compatible: Use HVP as a column for multi-instrument volatility scanning.
- Regime-Based Filtering: Build automated filters that only fire when volatility meets your conditions.
- Backtesting Ready: Consistent non-repainting logic for historical validation.
How It Compares
How this stacks up against typical volatility indicators on the market.
| Feature | ScalperIntel | Typical Indicators |
|---|---|---|
| Volatility Context | ✔ Ranks against historical sample | ⚠ Raw volatility only |
| Market Regime Filtering | ✔ Contraction / expansion / elevated | ⚠ Manual interpretation |
| Visual Display | ✔ Histogram, MA, heatmap | ⚠ Single line typically |
| Repainting | ✔ Non-repainting | ⚠ Varies |
| Automation | ✔ Strategy Builder ready | ✖ Visual only |
| Market Analyzer Use | ✔ Yes | ⚠ Limited |
Compatibility
Platform Support
- NinjaTrader 8 — Latest stable build. Works across all NT8-supported instruments.
- Strategy Builder — HVP value, MA, and HV all exposed for full automation.
- Market Analyzer — Use HVP as a column for multi-instrument scans.
- BloodHound — Integrate HVP with BloodHound logic packs.
- Blackbird — Strategy chains supported.
Reliability & Trust
- ✔ Volatility calculations based on confirmed bar data — no repainting
- ✔ No forward-looking adjustments
- ✔ Reliable for live trading, Strategy Builder backtesting, and Market Analyzer
- ✔ Continuously updated — bug fixes and new features included with every Lifetime License
FAQ
What does HVP show?
It shows where current historical volatility ranks compared to a selected historical sample. A high percentile means volatility is elevated relative to recent history; a low percentile means it's compressed.
Does it repaint?
No. Volatility calculations are non-repainting, based on confirmed bar data.
What does the Statistical Sample control?
The historical comparison window used to rank current volatility. A larger sample gives a more stable baseline; a smaller sample makes the indicator more responsive to recent regime changes.
How do I use the heatmap?
Red (>90%) and orange (>80%) mark unusually high volatility — favorable for breakouts but risky for mean reversion. Blue (<70%) marks compression — favorable for range trading and breakout-anticipation setups.
Can it be used in automated strategies?
Yes. HVP value, HVP MA, and historical volatility plots support NinjaTrader Strategy Builder, custom strategies, Market Analyzer, and backtesting.
Will I get future updates?
Yes — every Lifetime License includes all minor updates and bug fixes for as long as the product exists. Major version upgrades are also included.

-
License Terms
Prices shown are for a single license. Each license can be linked to one NinjaTrader User ID, allowing the indicator to run on up to two machines concurrently under the same User ID.
Version minor upgrades and bug fixes are included within the lifetime license. For more license details, review Terms of Service
-
Refund Terms
7-days 100% money back guarantee when trial licenses was not offered for the customer. For more details, review Refund Policy
