


ScalperIntel
Buyside & Sellside Liquidity
Buyside & Sellside Liquidity
Couldn't load pickup availability
ICT Liquidity Indicator for NinjaTrader – Identify Buyside & Sellside Liquidity Zones
Understand where the market is likely to move next by identifying liquidity pools, stop clusters, and inefficiencies based on ICT concepts. This indicator highlights key liquidity levels and voids, giving you a structural edge in anticipating reversals and continuations.
Built around institutional liquidity concepts used in modern price action trading.
Markets move toward liquidity. Most retail traders focus on price, while institutions target stop clusters. This tool helps you visualize where liquidity is resting, allowing you to align your trades with how the market actually moves.
Key Features
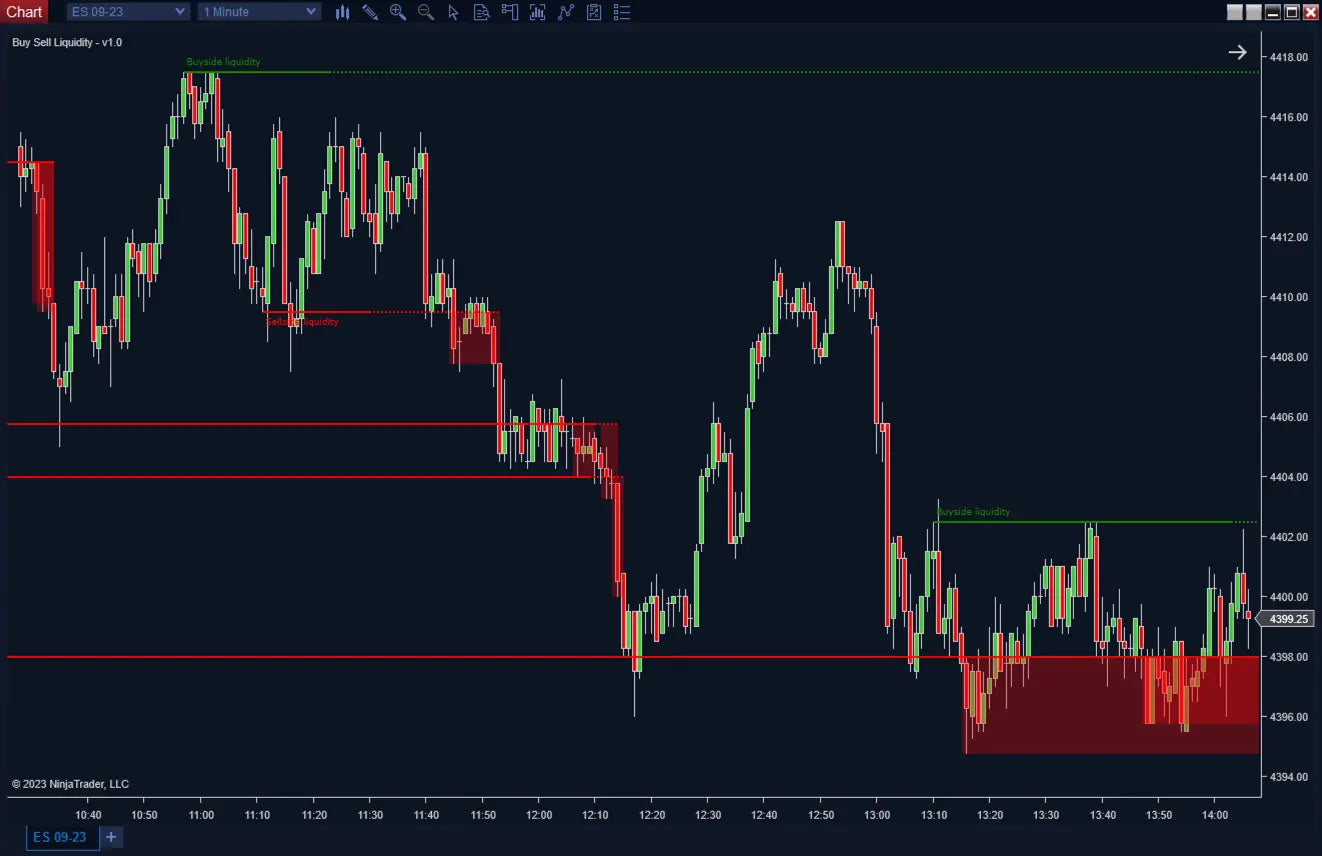
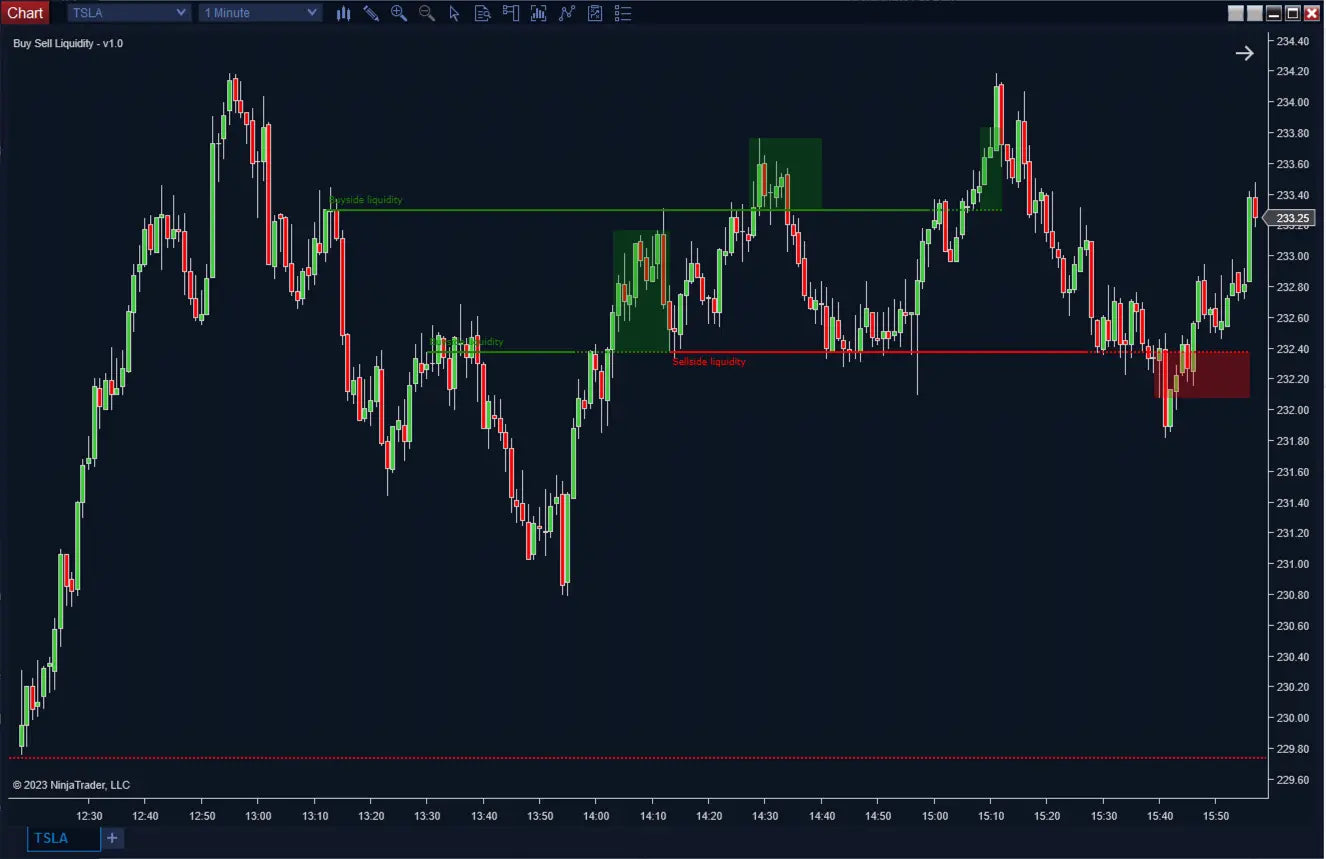
- Buyside Liquidity Detection: Identifies stop clusters above highs where short sellers are likely to be stopped out, acting as potential resistance or target zones.
- Sellside Liquidity Detection: Highlights stop clusters below lows where long traders are positioned, forming potential support or reversal areas.
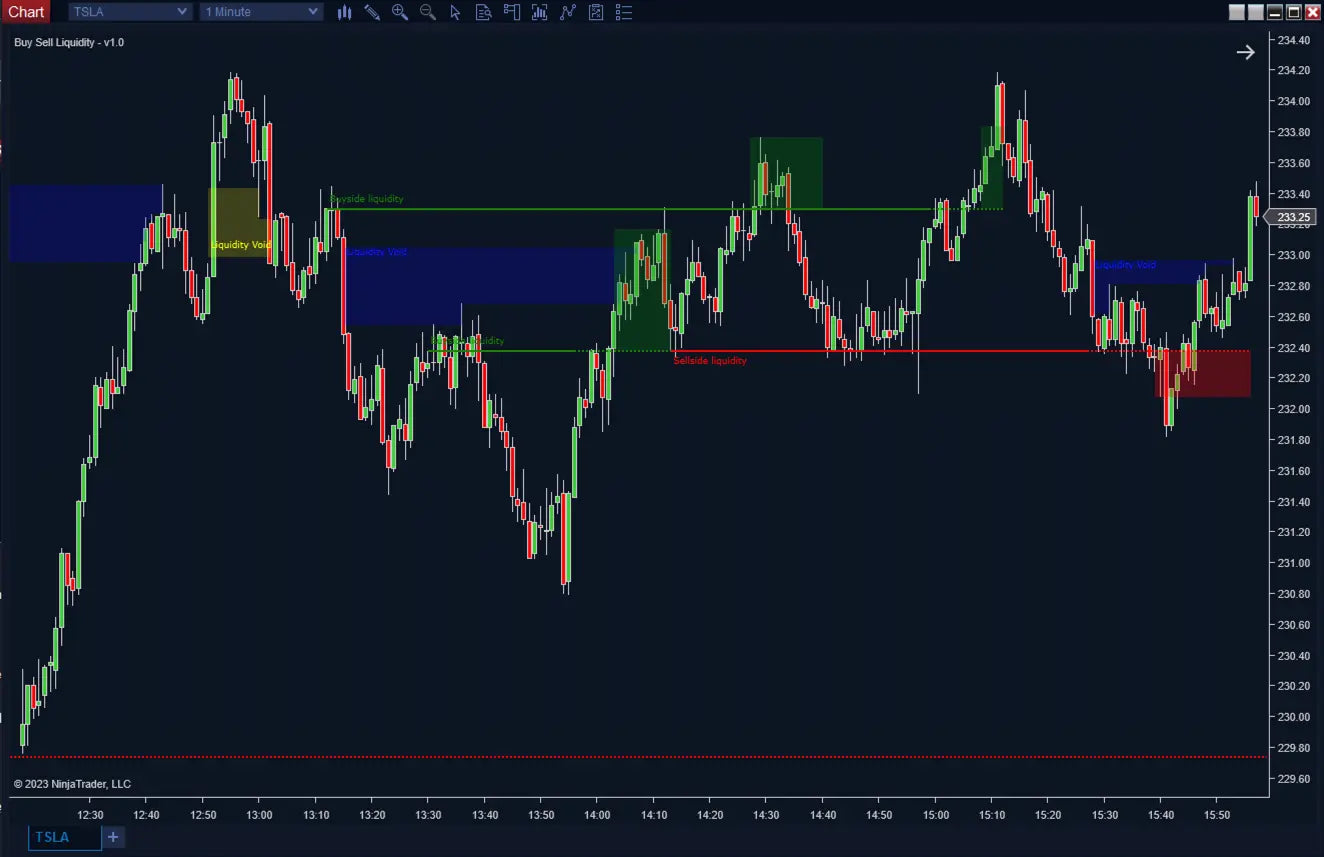
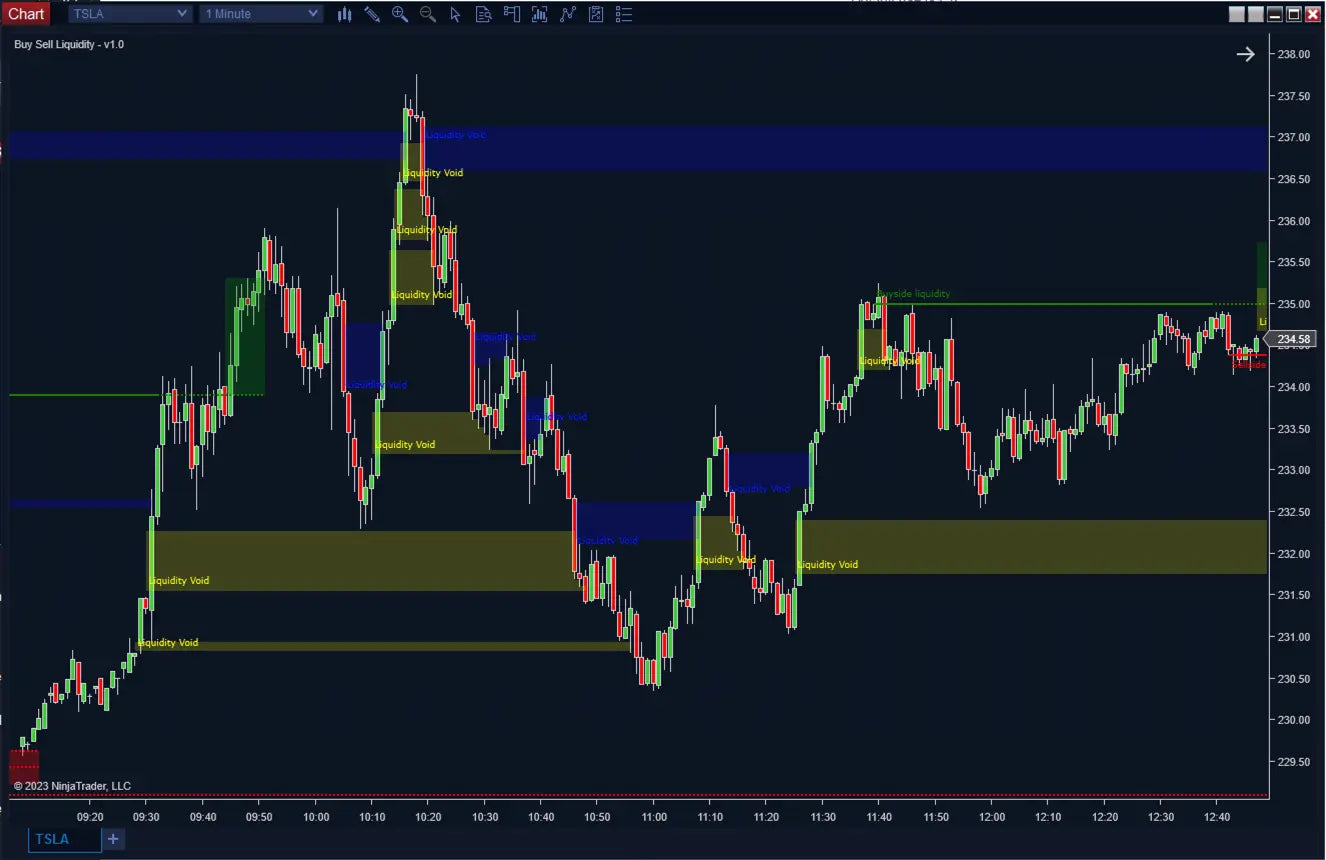
- Liquidity Voids: Detects inefficiencies created by rapid price movement — areas that price often revisits and fills over time.
- Dynamic Liquidity Zones: Automatically updates and extends levels as price evolves.
- Historical vs Real-Time Mode: Display past liquidity levels or focus only on current market structure.
- Custom Detection Length: Define how far back the indicator scans for pivot highs and lows.
- Margin Control: Adjust distance for projected stop-loss and take-profit zones relative to liquidity levels.
- Automation-Ready Hidden Plots: Includes next buyside and sellside levels for strategy development.
Advanced Trading & Automation
- Strategy Builder Compatible: Access nextBuyside and nextSellside levels for automated strategies.
- Liquidity Targeting: Identify where price is likely to move to trigger stops.
- Reversal & Continuation Zones: Highlight areas where liquidity sweeps may cause reactions.
- Void Fill Opportunities: Trade inefficiencies as price returns to fill gaps.
- Market Structure Integration: Combine with order flow or structure-based strategies.
Trading Concepts Covered
- ICT Liquidity Concepts
- Buyside & Sellside Liquidity Pools
- Stop Hunts and Liquidity Sweeps
- Market Inefficiencies (Liquidity Voids)
- Support and Resistance via Liquidity
- Institutional Price Targeting
What Makes This Different
- Focused on liquidity mechanics, not just price action
- Built directly around ICT methodology
- Combines liquidity zones + voids in one tool
- Provides forward-looking levels (next liquidity targets)
- Fully automation-ready for systematic trading
How It Works
The indicator scans pivot highs and lows to identify areas where traders are likely to have placed stop orders. These zones become liquidity pools that price is naturally drawn toward.
According to the manual, Buyside liquidity represents stop clusters above highs, while Sellside liquidity represents stop clusters below lows.
It also detects liquidity voids — rapid price movements that create gaps in trading activity, which the market tends to revisit and fill.
How It Compares
| Feature | ScalperIntel | Typical Indicators |
|---|---|---|
| Liquidity Detection | ✔ Buyside & Sellside | ✖ Not Available |
| Stop Cluster Mapping | ✔ Yes | ✖ No |
| Liquidity Voids | ✔ Built-in | ✖ Missing |
| Forward Targets | ✔ Next Levels | ⚠ Static levels |
| Automation Ready | ✔ Yes | ⚠ Limited |
Platform Compatibility
NinjaTrader 8
Compatible with Strategy Builder, BloodHound, and Blackbird
Important Notes
Concept-Based Indicator:
This tool is based on ICT liquidity concepts and should be used alongside market structure and confirmation tools.
Liquidity Does Not Guarantee Reversal:
Liquidity zones indicate areas of interest, not guaranteed turning points.
Customization:
Detection length and margin settings allow adaptation to different trading styles and timeframes.
Frequently Asked Questions
What is buyside liquidity?
It represents stop orders above highs, typically from short sellers, and often acts as a price target.
What is sellside liquidity?
It represents stop orders below lows, typically from long traders, forming potential support or reversal zones.
What are liquidity voids?
They are gaps created by rapid price movement that the market often revisits and fills.
Can this be automated?
Yes. The indicator provides hidden plots including next liquidity levels for strategy automation.
Stop trading price alone — understand where liquidity sits and where the market is most likely to go next.
Follow the liquidity. Anticipate the move. Trade with intent.
Recommended Timeframe
Recommended Timeframe
Mulitimeframe
Supported Systems
Supported Systems
NinjaTrader 8, SharkIndicators Bloodhound 1 and 2, and SharkIndicators Blackbird 1
Version
Version
1.0
First Release Date
First Release Date
-
License Terms
Prices shown are for a single license. Each license can be linked to one NinjaTrader User ID, allowing the indicator to run on up to two machines concurrently under the same User ID.
Version minor upgrades and bug fixes are included within the lifetime license. For more license details, review Terms of Service
-
Refund Terms
7-days 100% money back guarantee when trial licenses was not offered for the customer. For more details, review Refund Policy