ScalperIntel
Wyckoff Volume Spread Analysis
Wyckoff Volume Spread Analysis
Couldn't load pickup availability
Wyckoff Volume Spread Analysis, invented by Richard D. Wyckoff is one of the most important concepts of technical analysis.
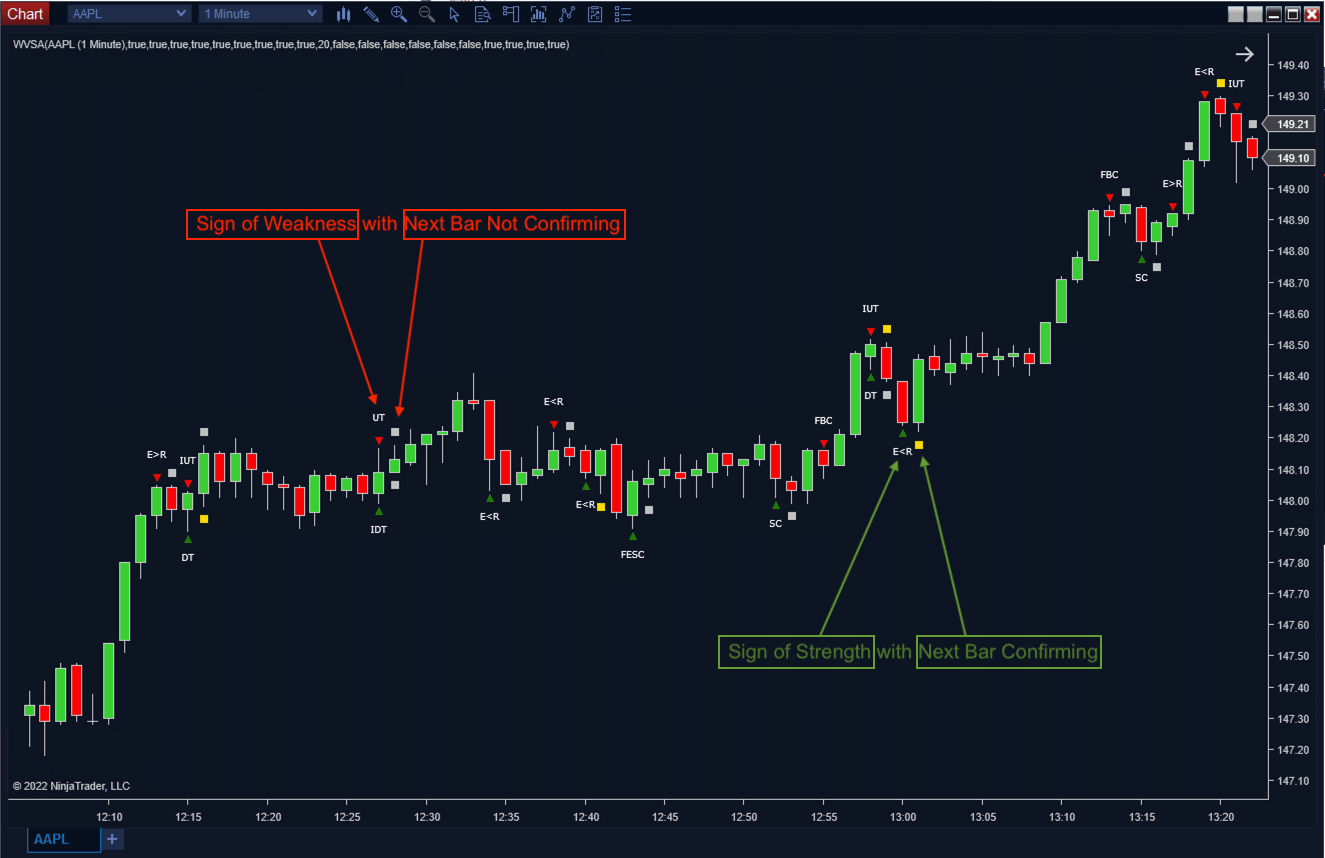
This indicator focuses on identifying the Sign of Strength (SOS) and the Sign of Weakness (SOW) for you and plot that on the Chart. This indicator also studies "The Next Bar" to confirm/refute SOS/SOW.
The SOS/SOW points are identified with triangles on the chart, and on the next bar, a rectangle is plotted with Gold (to confirm) or Silver (to refute) the previous SOS/SOW. The signals identified are
Sign of Strength (SOS)
1-DT (Down Thrust)
2-SC (Selling Climax)
3-E<R (Effort Less than Result)
4-E>R (Effort More than Result)
5-NS (No Supply Bar)
6-PDT (Pseudo Down Thrust)
7-PIDT (Pseudo Inverse Down Thrust)
8-IDT (Inverse Down Thrust)
9-FESC (Failed Effort Selling Climax)
Sign of Weakness (SOW)
1-UT (Up Thrust)
2-BC (Buying Climax)
3-E<R (Effort Less than Result)
4-E>R (Effort More than Result)
5-ND (No Demand)
6-PUT (Pseudo Up Thrust)
7-PIUT (Pseudo Inverse Up Thrust)
8-IUT (Inverse Up Thrust)
9-FBC (Failed Buying Climax)
Also, the indicator provides several plots to identify the category (1-9 as above) and impact (1 or 0) and next bar confirmation (1 or 0)
Version 1.1 New Features
- Adjust the Pin Bar calculation
- Adjust Volume Filter
- Ability to ignore Doji Candlestick
Features
Features
Recommended Timeframe
Recommended Timeframe
Mulitimeframe
Supported Systems
Supported Systems
NinjaTrader 8, SharkIndicators Bloodhound 1 and 2, and SharkIndicators Blackbird 1
Version
Version
1.1
First Release Date
First Release Date


-
License Terms
Prices presented above are per Single Machine.
Version minor upgrades and bug fixes are included within the lifetime license. For more license details, review Terms of Service
-
Refund Terms
7-days 100% money back guarantee when trial licenses was not offered for the customer. For more details, review Refund Policy
Special Offers


