


ScalperIntel
Market Structure Dashboard
Market Structure Dashboard
Up to 2
machines per license
- Instant download after checkout
- Lifetime updates included
- NinjaTrader 8 compatible
- Direct support from the team
Couldn't load pickup availability
Overview
Market Structure Dashboard for NinjaTrader 8 — a multi-timeframe Smart Money command center that reads Market Structure (HH/HL/LH/LL), Order Blocks, Fair Value Gaps, ICT Killzones & Sessions, and a single weighted Trend Bias across up to 7 timeframes at once.
Built for traders who want top-down clarity without flipping charts. Non-repainting, automation-ready, Strategy Builder compatible.
What Makes It Different
Trading Concepts You'll Use
- Multi-timeframe market structure — Higher High, Higher Low, Lower High, Lower Low
- Order Blocks & Fair Value Gaps (institutional supply/demand and imbalances)
- Swing sweeps, liquidity grabs and reclaimed highs/lows
- ICT Killzones — Asian, London, NY AM, NY Lunch, NY PM
- Trading sessions (Asian / London / New York) in US Eastern
- Prior Day, Week & Month highs and lows (PDH/L, PWH/L, PMH/L)
Features
Core Detection
- Multi-Timeframe Structure: Last three swing labels plus a bias arrow on every active timeframe, confirmed at bar close.
- Swing H/L Marker: A graphical bar showing exactly where price sits in the current swing range — inside, broken, or swept & reclaimed.
- Order Blocks & FVGs: Nearest unmitigated zone direction and distance per timeframe, with detection logic mirroring OrderBlocksPlus and FairValueGap.
- EMA Trend: Distance of price from the EMA with direction, per timeframe.
- Current Timeframe & Context: Live volume state, ATR-based volatility, active session and killzone for the chart timeframe.
- HTF Levels: Prior Day, Week and Month high/low ranges, each with its own swing marker.
- Weighted Trend Bias: A single BULLISH / LEAN BULL / NEUTRAL / LEAN BEAR / BEARISH read from all enabled timeframes and factors.
Automation & Pro Tools
- Strategy Builder Ready: Every dashboard value — bias, structure, swing, OB/FVG, session, killzone, HTF levels — exposed as hidden plots for backtesting and automation, no NinjaScript required.
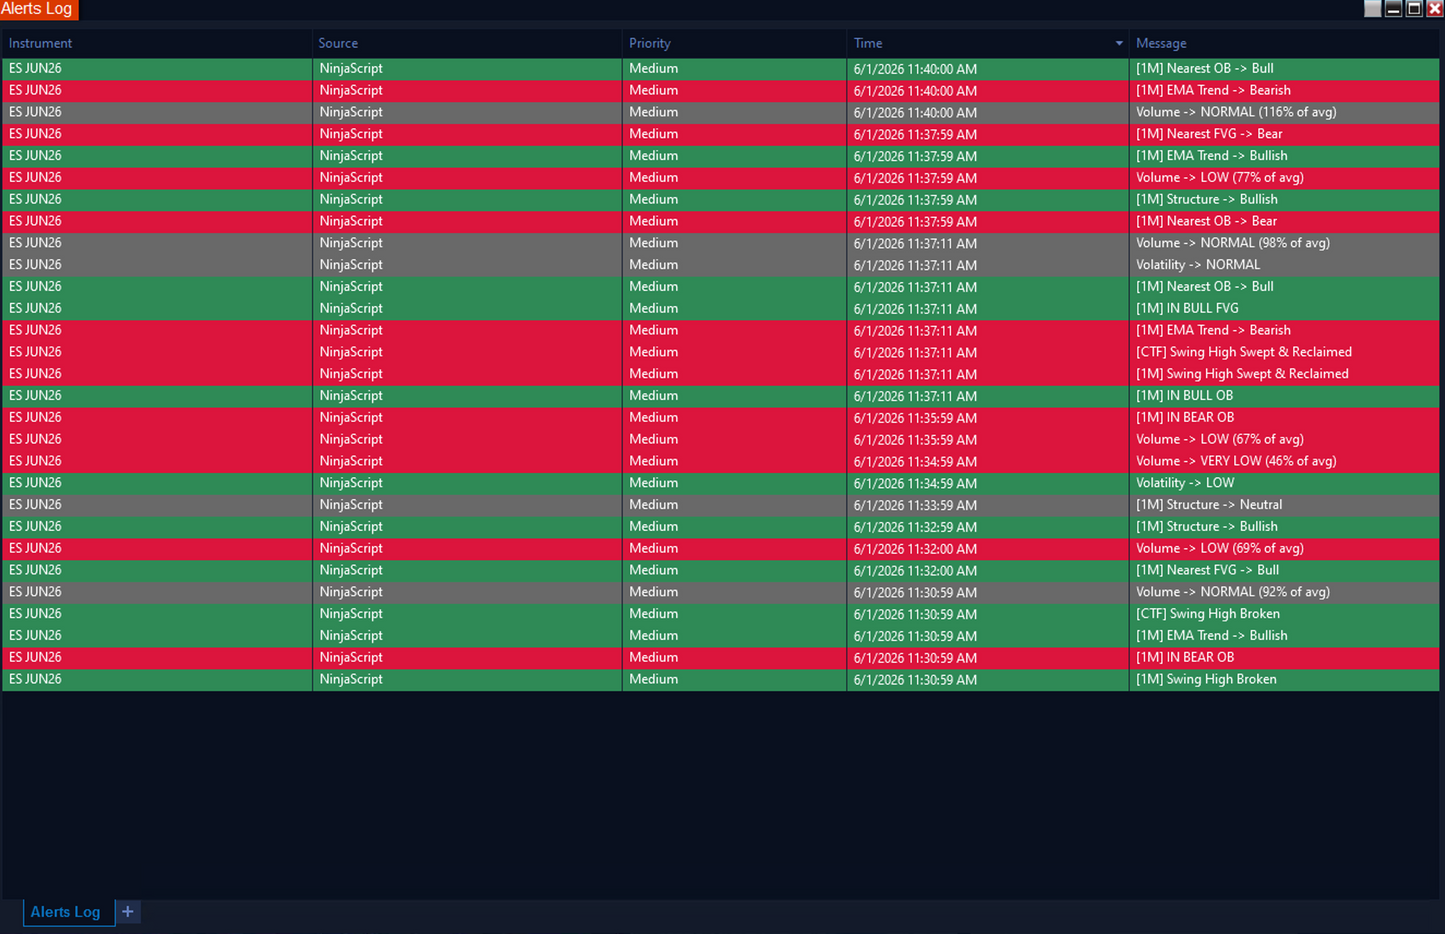
- Full Alert Suite: Swing breaks & sweeps, structure shifts, OB/FVG entries, EMA flips, volume & volatility changes, session/killzone changes, bias changes, and HTF level breaks/sweeps.
- Chart Overlays: Optional EMA line, Order Block and FVG zones, swing lines/labels and prior day/week/month level lines.
- Customizable Display: Dark or light theme, nine dashboard positions, distance shown as Percent, Price, Pips or Ticks, and fully adjustable colors.
How It Compares
How this stacks up against typical market structure and multi-timeframe indicators on the market.
| Feature | ScalperIntel | Typical Indicators |
|---|---|---|
| Timeframes Monitored | ✔ Up to 7 at once | ✖ Single chart only |
| Structure + OB + FVG | ✔ All in one panel | ✖ Separate tools |
| Weighted Trend Bias | ✔ Adjustable per timeframe | ✖ Not available |
| Sessions & ICT Killzones | ✔ Built in | ⚠ Rare / add-on |
| Non-Repainting | ✔ Confirmed at bar close | ⚠ Often unclear |
| Strategy Automation | ✔ 50+ hidden plots | ✖ Rare |
Compatibility
Platform Support
- NinjaTrader 8 — Latest stable build. Works on all instruments NT8 supports — Futures, Forex, and more.
- Strategy Builder — Every dashboard value exposed as hidden plots for backtesting and full automation. No NinjaScript required.
- BloodHound — Plots integrate directly into BloodHound logic packs.
- Blackbird — Strategy chains supported.
Reliability & Trust
- ✔ Structure, swings, order blocks and FVGs confirmed on bar close — no repainting
- ✔ No forward-looking adjustments or hindsight modifications
- ✔ Reliable for live trading, Strategy Builder automation, and backtesting
- ✔ Continuously updated — bug fixes and new features included with every Lifetime License
FAQ
Does this dashboard repaint?
No. Structure, swings, order blocks and fair value gaps are confirmed at bar close. What you see live is exactly what was available at the candle close — backtest results match forward results.
How many timeframes can I display?
Up to 7 at once. Each slot can be enabled, set to any timeframe from 1-minute to monthly, and given a weight so higher timeframes can dominate the overall trend bias.
How does the Trend Bias score work?
Each enabled timeframe votes from your chosen factors — structure, order block, FVG, EMA and swing position. Votes are multiplied by that timeframe's weight and summed into one score, shown as BULLISH, LEAN BULL, NEUTRAL, LEAN BEAR or BEARISH.
Can I use it for automated trading?
Yes. Every value on the dashboard is exposed as a hidden plot for Strategy Builder, NinjaScript and algorithmic strategies — read the bias, structure, zones, session and HTF levels directly with no NinjaScript required.
What markets does it work on?
Works on Futures, Forex, and any instrument supported by NinjaTrader. Tested heavily on NQ, ES, RTY, GC, CL, and major FX pairs.
What chart types does it work on?
Any chart type. The Market Structure Dashboard runs on time-based, tick, range, volume and Renko charts alike. Just keep one thing in mind: the multi-timeframe rows are always time-based — 1-Minute, 3-Minute, 5-Minute, 15-Minute, 30-Minute, 45-Minute, 1-Hour, 2-Hour, 3-Hour, 4-Hour, Daily, Weekly and Monthly. They pull their own time data regardless of what your chart is built on, so a tick or range chart won't change what the higher-timeframe rows show. The Current Timeframe section and the on-chart overlays — order blocks, fair value gaps, swing markers, levels and EMA — follow your actual chart, so on a tick chart they reflect your tick bars. Tip: on very fast charts (e.g. low tick counts) the dashboard loads extra timeframe data in the background, so give it a moment to populate on first load.
Is it heavy on my machine? How many timeframes should I run?
Each enabled timeframe runs its own full detection engine, so the dashboard does genuine work behind the scenes — running all 7 at once is powerful, and naturally a little heavier than a single-timeframe tool. Most traders simply enable the timeframes they actually trade from, which keeps everything smooth and responsive. If you'd ever like it lighter, just disable a timeframe or two or trim your loaded chart history.
Will I get future updates?
Yes — every Lifetime License includes all minor updates and bug fixes for as long as the product exists. Major version upgrades are also included.


-
License Terms
Prices shown are for a single license. Each license can be linked to one NinjaTrader User ID, allowing the indicator to run on up to two machines concurrently under the same User ID.
Version minor upgrades and bug fixes are included within the lifetime license. For more license details, review Terms of Service
-
Refund Terms
7-days 100% money back guarantee when trial licenses was not offered for the customer. For more details, review Refund Policy
